Jump to content


Photo

Gold ... All hands abandon ship !


  • Please log in to reply
40 replies to this topic

#31 MDurkin

MDurkin

    Member

  • Traders-Talk User
  • 638 posts

Posted 05 January 2013 - 06:47 AM

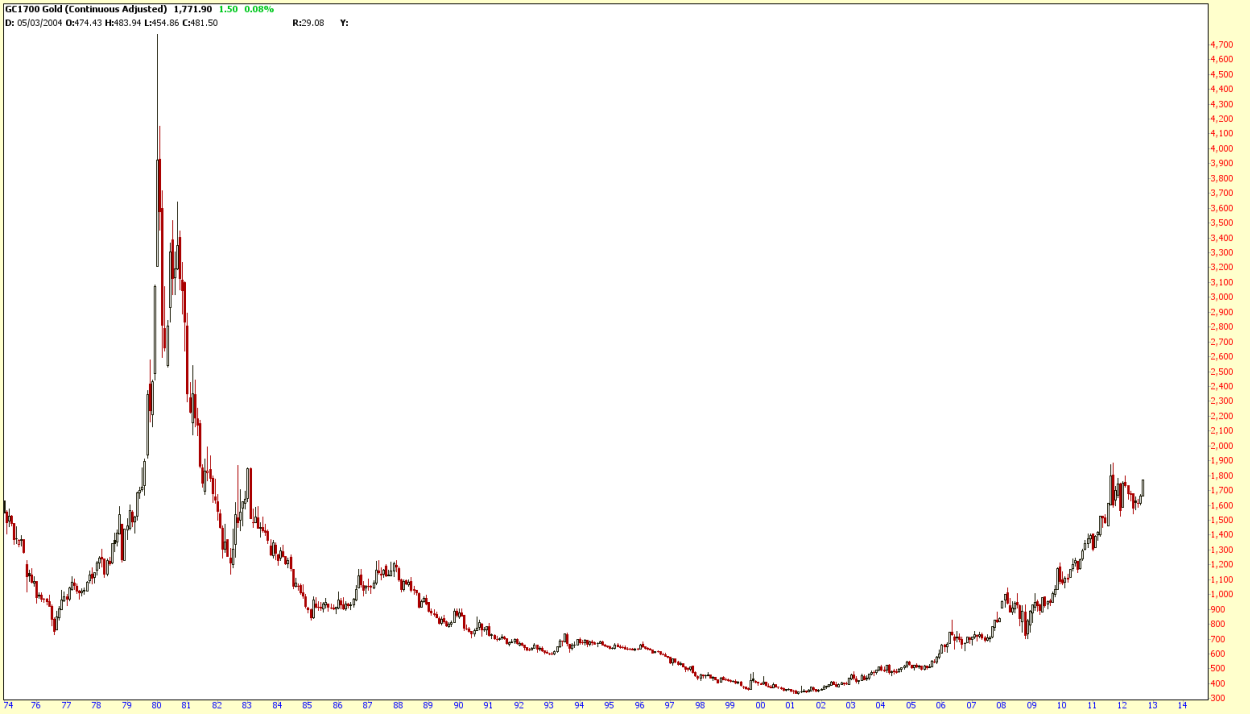
Interesting Astro Gold chart showing a double top in 2015 and then spring 2016, this is the same time frame I see using a mechanical oscillator and Martin Armstrong is also calling for about 5000 gold by 2016, Armstrong has warned of this global debt crisis we are in since the 1980's , he believes the bonds are going to be defaulted on in Europe, Japan and the USA when that happens the [bleeeep] will hit the fan! Worldwide debt is no close to 50 Trillion and increases about 350,000 dollars a second, interest rates are going to start rising next year as it is a pi cycle year for the bonds, when the bonds and currencies start crashing capital will flee to gold. The west's experimentation with debt and socialism is going to end badly just as communism did. From a contrarian perspective look at all the naysayers on this message string.


Maybe we have both views as being correct.

http://dl.dropbox.co...ro-Ju-Ce-Ma.gif

http://dl.dropbox.co...ia-Ju-Sa-Ur.gif


So the Dow corrects 1/11-1/25 Gold has a bounce as the Dow corrects. The Dow than takes off to all time highs late April early May completing the large megaphone formation from 2000- http://stockcharts.c...c/1169350/tenpp. At the same time GLD goes to 141-128 everyone thinks the Gold bull is dead. But no as the Dow goes Down for 2 and a half years aka 1929-1932 Gold takes off at the same time they meet in October 2015 at 5000. Than the Dow goes up for 4 years aka 1937-1941 Gold corrects.
Maybe?


Two schools of thought . Interest rates are going to rise like the 70's others say they are going to fall like the 30's. I think we have been in a secular bear market since 2000. Each correction since that time yields have drop- people ran to bonds. This has not changed to date. If the charts that I posted come to pass I see 2 scenarios.

1) Interest rates continue for the duration of the secular bear to behave just as they have- a safe haven. This does not mean Gold can not go to 5000 in fact this is the better of the 2 scenarios and the one I lean towards.

2) At some point we have a correction and interest rates rise during the correction, that would be a game changer for me and I would not walk,jog,run but sprint to Gold and Silver, can you say 12000 Gold and 1000 Dow. I do not expect this to happen- it would be the nightmare outcome- think Germany and wheel barrels.

So just watch every correction. I think we have a 10 percent one coming soon- next week up, than 2 weeks down.

Edited by MDurkin, 05 January 2013 - 06:52 AM.


#32 fib_1618

fib_1618

    Member

  • Traders-Talk User
  • 10,145 posts

Posted 05 January 2013 - 11:56 AM

Just to finish off the thread, I just updated the A/D lines for both the composite Precious Metals and XAU Advance/Decline lines and they continue to hold their ground in the face of yesterday's intraday sell off. As long as this continues, the maximum downside we might see in spot gold would be the lower end of the trading range that was posted earlier in this thread. Any updates on this will be shared on the gold board in the future. Fib P.S. - Beautiful chart Russ...thanks for posting it.

Better to ignore me than abhor me.

“Wise men don't need advice. Fools won't take it” - Benjamin Franklin


"Beware of false knowledge; it is more dangerous than ignorance" - George Bernard Shaw


Demagogue: A leader who makes use of popular prejudices, false claims and promises in order to gain power.

Technical Watch Subscriptions


#33 Alton

Alton

    Member

  • TT Member+
  • 210 posts

Posted 05 January 2013 - 12:13 PM

Different time frames, approaches, and techniques make the market. Just for fun, here's another GLD chart... with almost any outcome you can imagine. No positions and no predictions from me. Choose your poison and do your own dd. -- Alton
GLDday20130104ForTreCycAlt.gif

#34 Russ

Russ

    Member

  • Traders-Talk User
  • 7,199 posts

Posted 05 January 2013 - 01:13 PM

This inflation adjusted Gold chart came from Terry Laundry's site originally and Wollie aka the chief mentioned it on his site...


Posted Image

Edited by Russ, 05 January 2013 - 01:16 PM.

"Nulla tenaci invia est via" - Latin for "For the tenacious, no road is impossible".
"In order to master the markets, you must first master yourself" ... JP Morgan
"Most people lose money because they cannot admit they are wrong"... Martin Armstrong


http://marketvisions.blogspot.com/

#35 Russ

Russ

    Member

  • Traders-Talk User
  • 7,199 posts

Posted 05 January 2013 - 02:14 PM

This chart looks pretty bullish to my eyes, contrary to OGM's breakdown it found support with a nice weekly doji!

Posted Image
"Nulla tenaci invia est via" - Latin for "For the tenacious, no road is impossible".
"In order to master the markets, you must first master yourself" ... JP Morgan
"Most people lose money because they cannot admit they are wrong"... Martin Armstrong


http://marketvisions.blogspot.com/

#36 risk_management

risk_management

    Member

  • Traders-Talk User
  • 1,772 posts

Posted 05 January 2013 - 05:51 PM

Very short term, if bonds and gold are still attached at the hip, the demise might not come just yet.

Posted Image

#37 Alton

Alton

    Member

  • TT Member+
  • 210 posts

Posted 06 January 2013 - 03:39 AM

This chart looks pretty bullish to my eyes, contrary to OGM's breakdown it found support with a nice weekly doji!

Posted Image

Russ, nice clarification of the IT positive elements in this chart. :) Thx


Very short term, if bonds and gold are still attached at the hip, the demise might not come just yet.

RM, I'm reading the words, but I don't see how bonds and gold are joined at the hip, except in response to fed action. Anecdotally, if the fed is buying bonds to keep interest rates low, bonds will rise. And if investors (fearing inflation) are buying gold because the fed is printing money -- aka buying bonds -- gold will also rise. But one doesn't require the other. If a correlation exists, it's probably coincidental, not causative. -- Alton

#38 Russ

Russ

    Member

  • Traders-Talk User
  • 7,199 posts

Posted 06 January 2013 - 01:52 PM

You're welcome Alton. The correlation between bonds and gold would be that as this international debt crisis has emerged capital has been seeking safety in both bonds and gold, eventually bonds will most likely not be seen as a haven as Martin Armstrong thinks will start to happen this year. We'll see.


Russ, nice clarification of the IT positive elements in this chart. :) Thx


"Nulla tenaci invia est via" - Latin for "For the tenacious, no road is impossible".
"In order to master the markets, you must first master yourself" ... JP Morgan
"Most people lose money because they cannot admit they are wrong"... Martin Armstrong


http://marketvisions.blogspot.com/

#39 fib_1618

fib_1618

    Member

  • Traders-Talk User
  • 10,145 posts

Posted 06 January 2013 - 02:31 PM

If a correlation exists, it's probably coincidental, not causative.

Fully agree...each and every asset class moves to the beat of its own distinctive drummer and sometimes these temporarily overlap without malice aforethought.

Fib

Better to ignore me than abhor me.

“Wise men don't need advice. Fools won't take it” - Benjamin Franklin


"Beware of false knowledge; it is more dangerous than ignorance" - George Bernard Shaw


Demagogue: A leader who makes use of popular prejudices, false claims and promises in order to gain power.

Technical Watch Subscriptions


#40 dougie

dougie

    Member

  • Traders-Talk User
  • 9,064 posts

Posted 07 January 2013 - 01:39 AM

ANd your thoughts on the Yen here are?
Historical levels of bearishness right now; i see a turn about 2% below

FWIW, I don't consider gold the primary instrument on this flight.

It's the $Yen.

That's the one you have to figure out.

Everything else will fall in line.