Price and time analysis has not worked well since the massive QE programs began almost 6 years ago, so I don't know if that will
change any time soon.
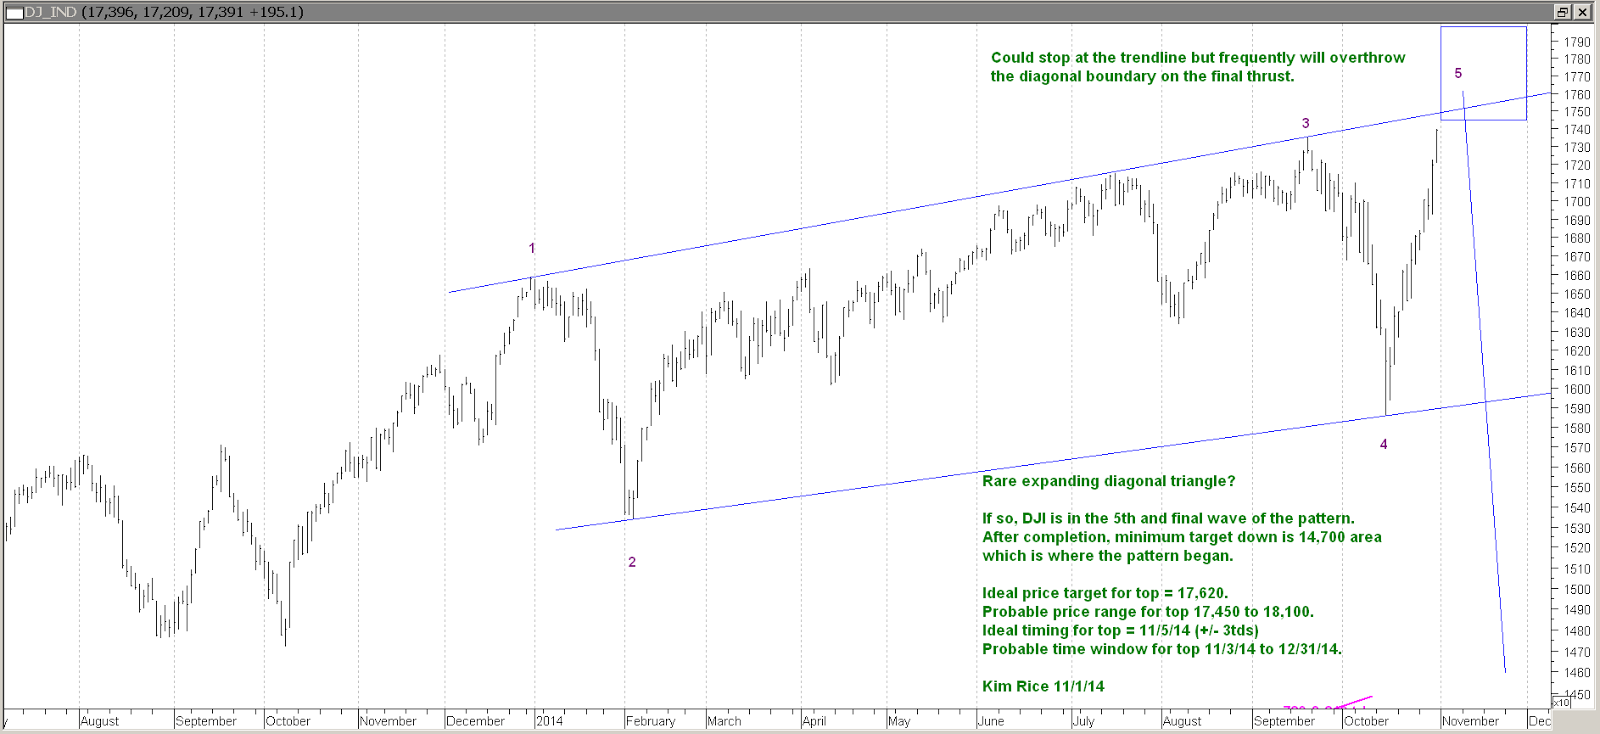
I think it's a fairly high probability this is the correct count from an E-wave and Edwards and McGee perspective. However, there are no absolutes when it comes to forecasting the markets. The invalidation point for this count would likely be a weekly close above 18,100. That would probably be too far for a normal 5th wave overthrow as the presumed pattern completes.
There is a potential time analog for a top on or near 11/5/14 based on 780 and 813 td symmetry with the last 3 year leg up into the 1987 top. Additional time and price guesswork is annotated on the chart.
Kimston