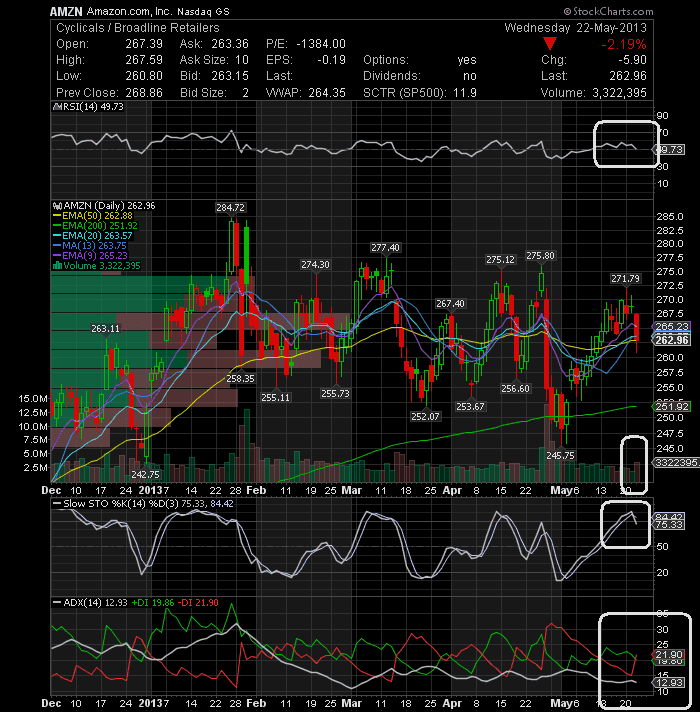
The stock chart shows a reversal day pattern on very high volumes, with the stock price closing near the lows of the day slightly above the EMA50. Stronger volumes on down days remain a concern. The technical indicators are showing signs of bearishness. The 9-day EMA has turned down and the 50-day EMA has flattened. The RSI has crossed below the 50% level, with a bearish cross of the %K line below the %D. In addition, the DI- crossed above the DI+ which is a bearish cross.
Stocks to Watch for May 23, 2013