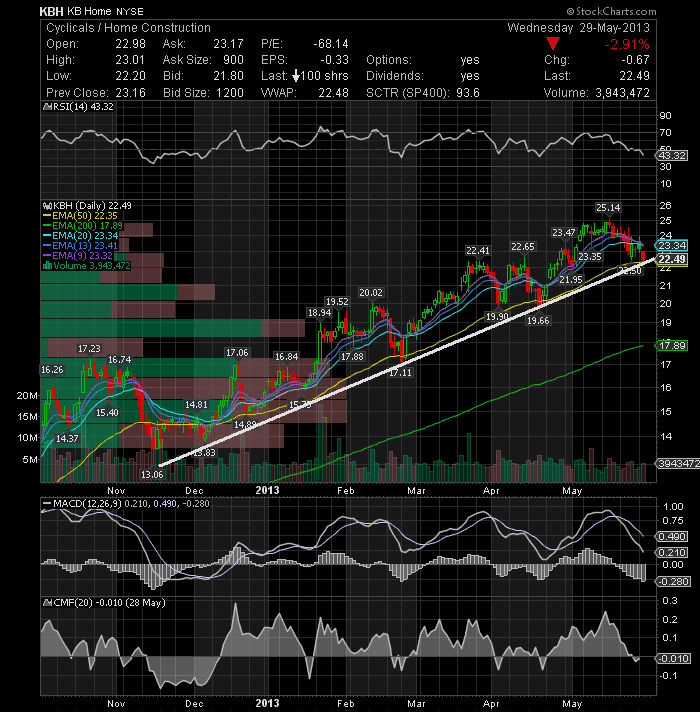
The stock is testing a major support zone 50-day EMA and medium-term trend line support. Play the reaction. From a technical perspective, the daily technical indicators are showing bearish signs. The MACD is positive but falling below its signal line. The RSI is below its 50% level and the CMF is negative. The stock is trading well above its rising 200-day EMA, which is a good sign, but at this level strict stop losses must be maintained. Keep a close eye on KBH tomorrow !
Stocks to Watch for May 30, 2013