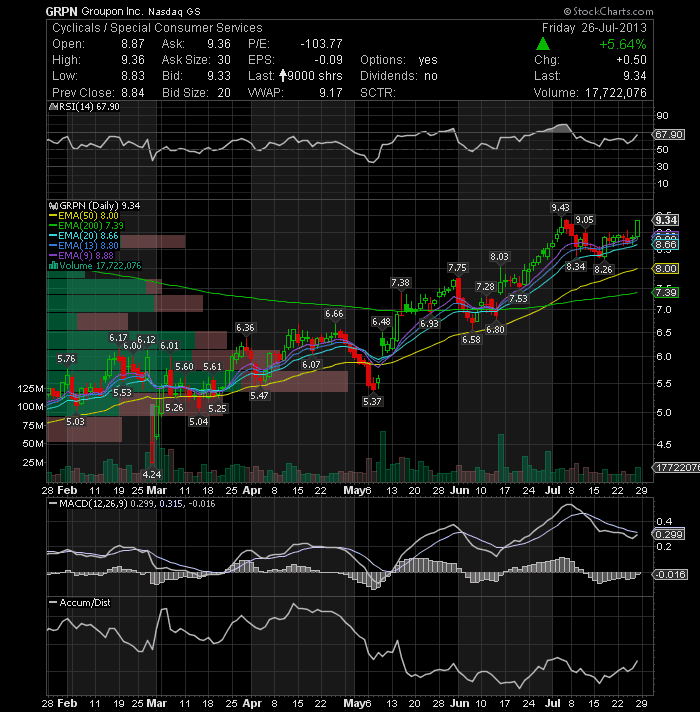
A breakout above the 9.43 resistance level would lead to an initial target in the 10 area, its high from June 2012 and then to levels not seen since mid-2012. Daily technical indicators are bullish. The technical indicator MACD is below its signal line but in positive territory. The RSI has moved above its 65% level and A/D line is on the rise. Additionally, the 50-day EMA has crossed above the 200-day EMA lately (Golden cross) and the stock is trading above all three EMAs. Long setup. Stop 8
Stocks to Watch for July 29, 2013