
Is end of the correction in sight?
Started by
Harapa
, Sep 01 2013 07:53 AM
1 reply to this topic
#1

Harapa
-
- Traders-Talk User
- 1,279 posts
Member
Posted 01 September 2013 - 07:53 AM
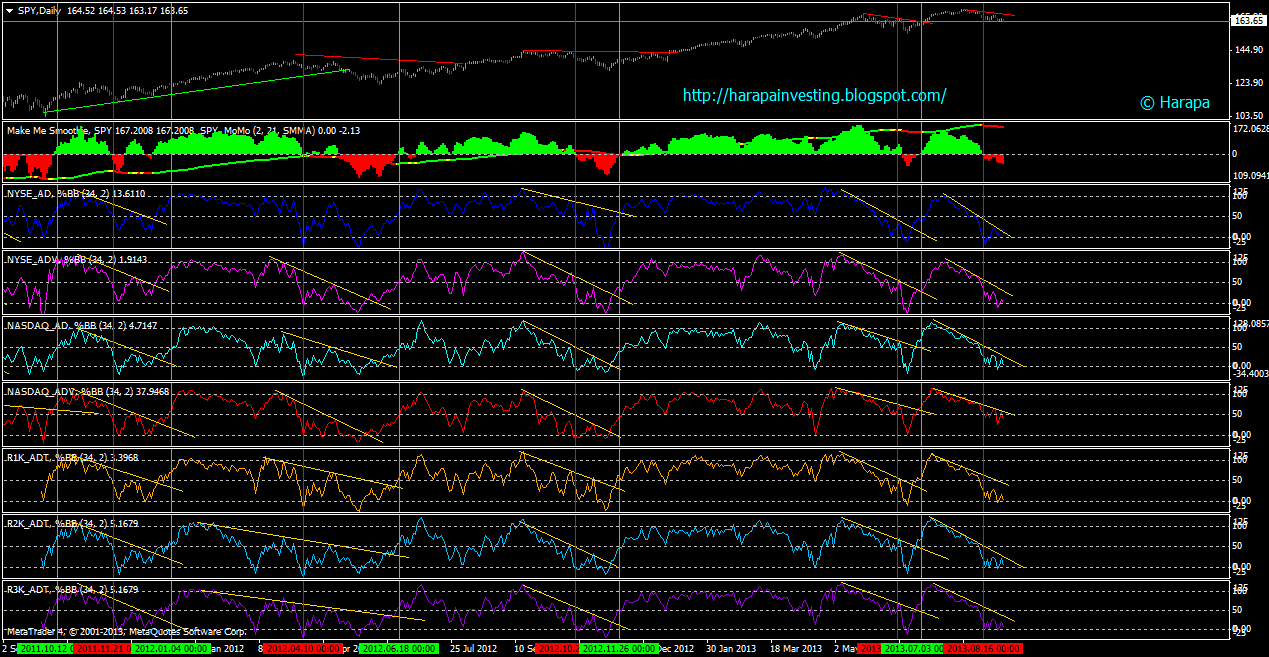
Watch this setup for a sign of true reversal. For this setup to turn Bullish (for US equities) lower indicators(%BB) need to climb above 50 or break the trend line, and momentum (of SPY) to turn positive. Bottom panels are derived using cumulative Advance Decline [Issues(AD/ADT) or Volume(ADV)] data.
My comments are for entertainment/educational purpose only. All posted trades are fake (aka. paper) trades.
#2
opinionated
-

- Traders-Talk User
- 4,937 posts
Member
Posted 01 September 2013 - 12:01 PM
In my opinion any weakness tuesday should be bought, looking for a st bottom maybe 5-10 points below us then a sharp rally to build a right shoulder possibly there is the tell if we roll over then I suspect 1550 is in the cards. No roll over then back to the highs. But I prefer the former.
Good trades
O


