Posted 23 November 2013 - 02:08 PM
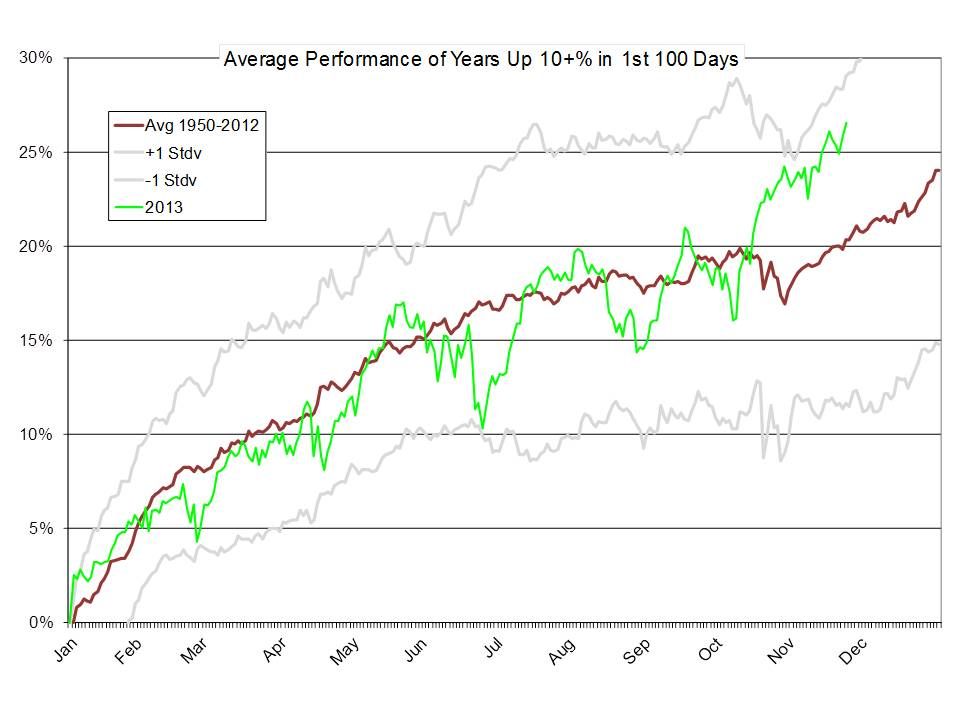
Despite a strong rally in the SPX since October, the index has still not touched the upper +1 STDev band, although it is getting close. The upper band would be touched if the SPX closes at 1843 on Monday. With Friday's close above 1800, the SPX has already exceeded the average yearend gain for similar years by 2 percentage points. Looks like there is not much more upside potential and a lot more downside risk. I am still long but hedging with SPY puts.
My last update on this topic:
http://www.traders-t...?...=149794&hl=
KMB
People think the Holy Grail is something looked for but never found. In fact, it is something often found but rarely recognized.