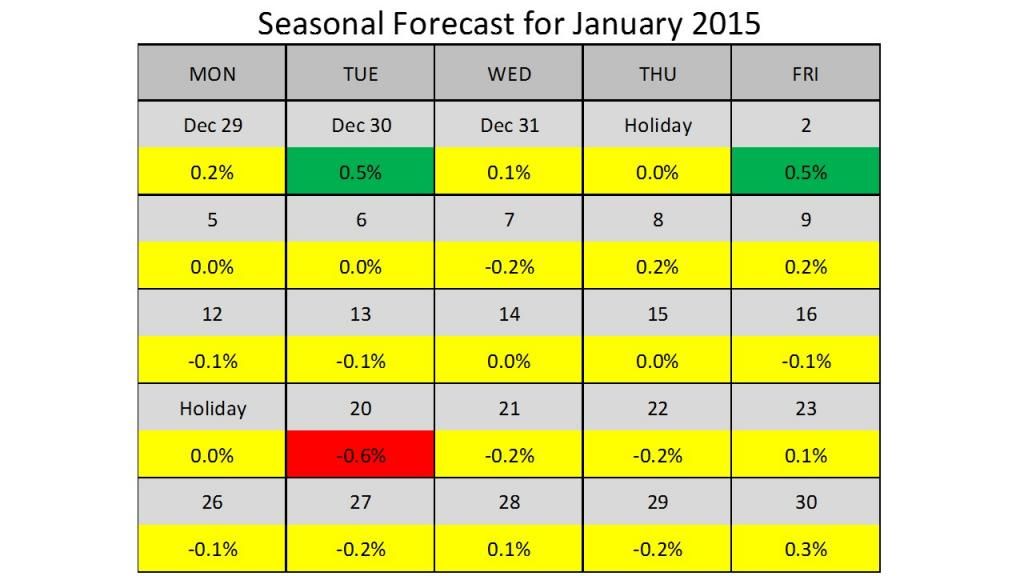
The January seasonal map does not offer a lot of guidance. The only green day was last Friday, and that was a bust. The rest of the first half of January looks flat based on the seasonals. If you are leaning towards the short side, the second half of January is your best bet. Six out of 7 days between Jan 16-27 have a negative bias, with a large negative bias on the 20th.

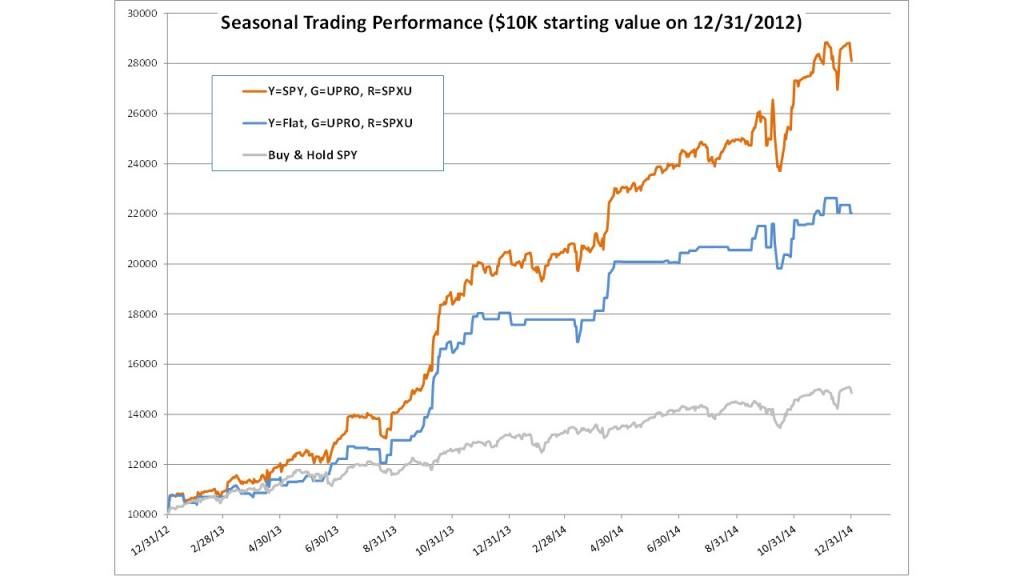
Back in April, I introduced a model utilizing 3X leveraged S&P 500 ETFs to take advantage of strong upside or downside bias days. Starting with $10K on 12/31/2012, the model buys the 3X bull ETF (UPRO) on green days, and buys the 3X bear ETF (SPXU) on red days. On yellow days the model is flat. The performance of this model is represented by the blue line in the chart below. For comparison, the dividend adjusted return of SPY is shown in gray.
At yearend, the model is up 120% compared to a 50% return in SPY. On it's own, the performance is not that impressive since you could have made roughly 3X the SPY by buying and holding UPRO. However, consider that the model was only invested 19% of the time and flat for 81% of the 24-month backtest period. That is hardly a fair comparison with being invested 100% of the time in UPRO during an extremely bullish time period.
I also show a second model using a similar strategy to the first for green and red days. The twist is, this model was invested in SPY on yellow days rather than being flat. The model (orange line in chart) was invested 100% of the backtest period and provides a fairer comparison with buy-and-hold. The model is up more than 180%, which is 130 percentage points above SPY buy-and-hold.
Now the caveats... These models are highly optimized, and the combination of optimization and compounding can generate fantastic results that are nearly impossible to duplicate in real time. Do not base your trades solely on seasonal bias. Use seasonals in conjunction with other indicators.
Good trading, KMB


