

Senor; assuming you mean 1191 from October http://schrts.co/WoYZD8??
The ending diagonal triangle, or wedge as many call it, is a narrowing price move composed of two converging trendlines highlighting a wave 5 (many times) extension pattern. The chart to the right shows the ideal example. The ending diagonal is a special type of motive wave that occurs primarily in the wave 5 position when price has moved too far and too fast. I like to think of it as a rising or falling consolidation. Some ending diagonal triangles appear in the C wave of anABC correction, but that configuration is rare. In all cases, the ending diagonal terminates the move of larger patterns.
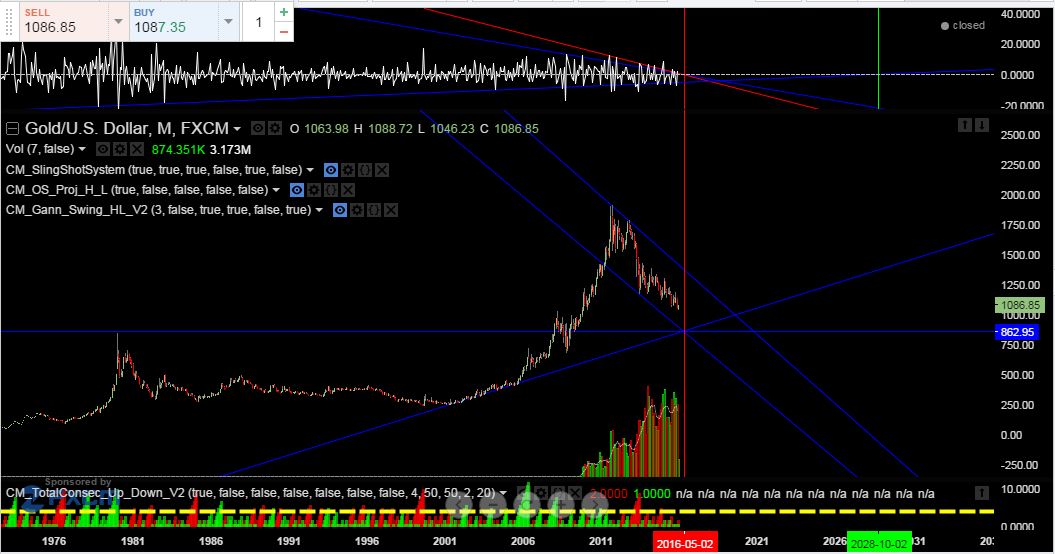
S,i the drop from 1191 to 1045 "could be" wave A of a final large 3-step ABC leg down to end a very large diagonal wave 5 of C to possibly end the entire 4 yr correction from 1921. I give it 40% odds vs 60% that a final low "might" be in place, just my opinion. If we now see a wave B up it would likely retrace 50--62& of that possible wave A decline.
My BS
Senor


