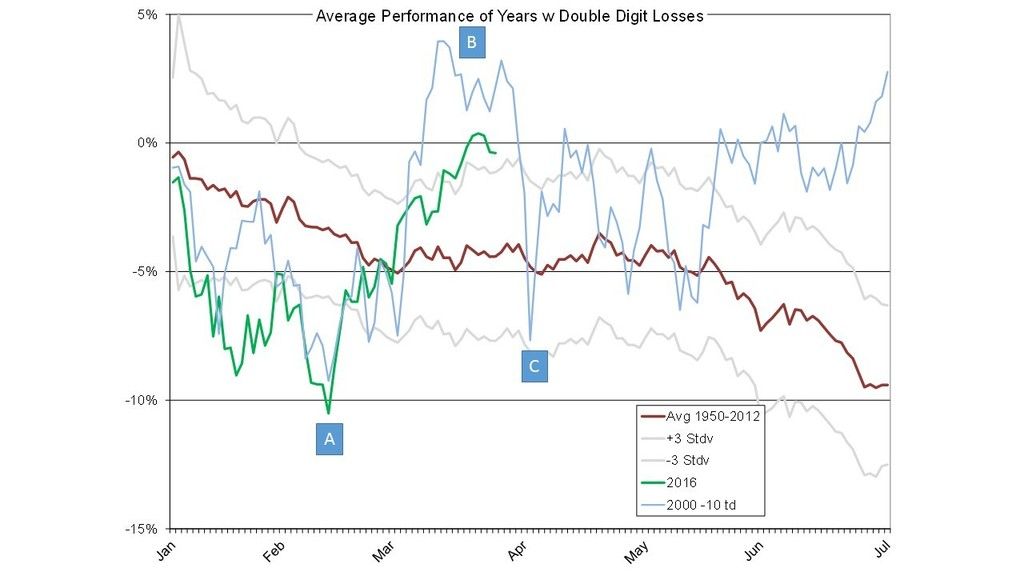
I updated the 2016 roadmap to show the latest SPX performance in green and the 2000 analog in blue. The labels A-C identify key turning points in 2000. The 2000 analog is shifted to the left by 10 trading days to align the 2000 Feb low with the Feb 11, 2016 low at turning point A.
We are still in the ideal time zone for a top at turning point B according to the '00 analog. Note that the 2000 top at point B was a messy 11-day affair, before price fell off the cliff to point C. The ideal timing for a low at point C is April 4, just 6 trading days away. If we do get a sharp decline in the next week or so, the low should be bought for a rebound rally based on the analog.
As always, corroborate this analysis with your own.


