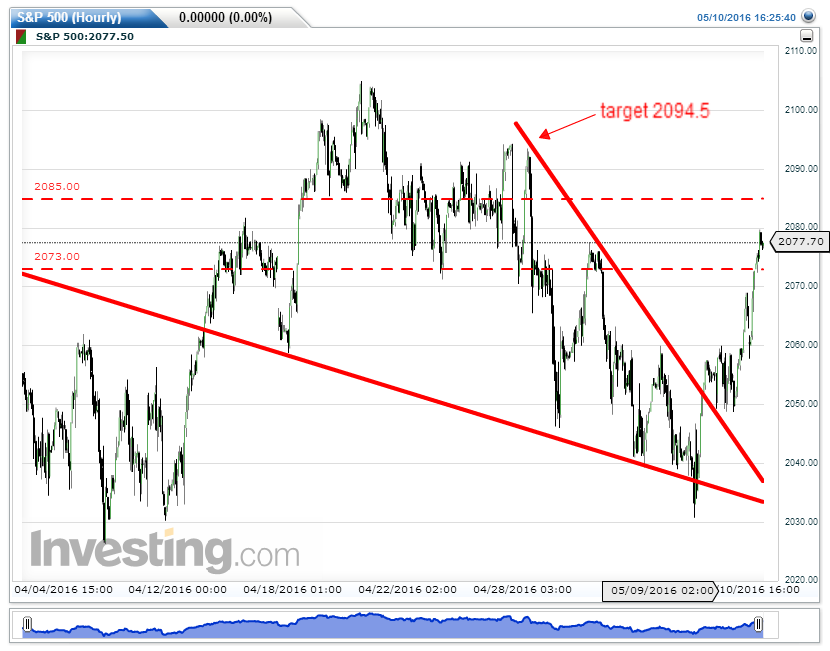
so bigger picture is dunk 2070-2080, but short term is bullish for spx, whereas rut is at a shortable line

Get to dunk ES 2073~2085 : reaching the LOL Top of 2/11 uptrend
Started by
iloli way
, Apr 14 2016 07:43 AM
per Perfect Game
23 replies to this topic
#12

iloli way
-
- TT Member*
-

- 4,028 posts
iloli = I'm Laws Of Line's I(eye)
Posted 09 May 2016 - 04:01 AM
Only 3 types of line on chart:
horizontal - price as a level - target (single) ; zone (double) is gap, corridor/pivot (battle ground).
vertical - time ; event/news/cycle.
slanted - price moving in dynamic slanted way; t/l (single) ; pattern (two) once you draw two slanted lines, it must form a pattern recognition; or it's meaningless.
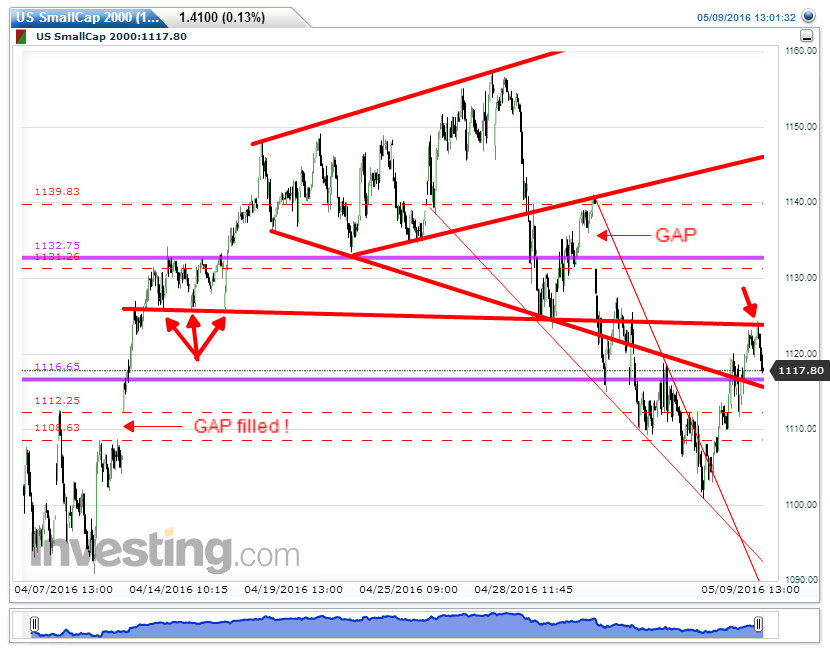
RUT : I've said and in chart a gap is still there above to be filled; it is just happen to be the 'falling wedge' upward BO target, how convenient.
ES/SPX : falling wedge BO target 2094.5...
that's how 2 read my chart.
4/22 posted: Watch out for FO fake out! when price just went new high through 'Dunk Zone'; coming and going are using the same corridor.
So it did just that, a FO.
Friday? and Sunday? need me repeat?
there are lot more "laws" to draw useful meaningful tradable lines. If you read my charts and comments closer, they will shine on you, halibabalooyah! 
PRICE IS KING; LINE RULES! - Laws Of Line (LOL) Trading Systems
Swing Those Lines: I can calculate the motion of heavenly bodies, but not the madness of people! -- Issac Newton
Swing Those Lines: I can calculate the motion of heavenly bodies, but not the madness of people! -- Issac Newton
#13
iloli way
-
- TT Member*
-
- 4,028 posts
iloli = I'm Laws Of Line's I(eye)
Posted 09 May 2016 - 04:16 AM
If I start a new topic w/new title other then this 'dunk zone 73~85 is the top of uptrend since 2/11'...
then you'll know it is not anymore.
PRICE IS KING; LINE RULES! - Laws Of Line (LOL) Trading Systems
Swing Those Lines: I can calculate the motion of heavenly bodies, but not the madness of people! -- Issac Newton
Swing Those Lines: I can calculate the motion of heavenly bodies, but not the madness of people! -- Issac Newton
#15
iloli way
-
- TT Member*
-
- 4,028 posts
iloli = I'm Laws Of Line's I(eye)
Posted 09 May 2016 - 05:02 PM
Quite alright ")
Let me raise some Qs for you, take RUT chart for example:
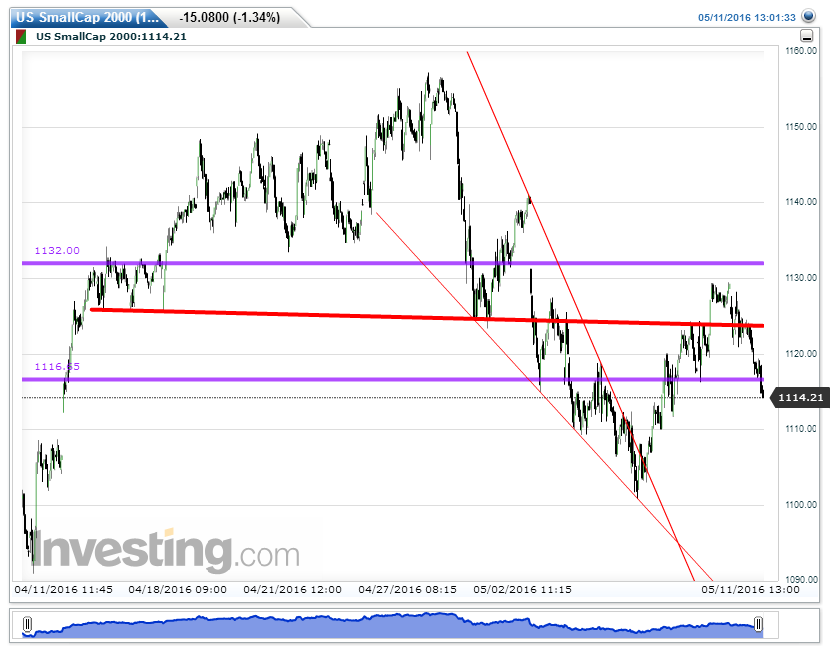
Why the wedge I drew not started from the highest price point? simple, only the next 3 peak price points can form a wedge. More peak or trough points make more reliable line. Therefore the target of BO only goes to top of the wedge tl, which is the second highest/1140/gap top/+thick red TL convergent point, not the highest price of last top. 1140 is also where the second thick red line kissed goodbye the top of wedge last time with a gap down. This implies: even if price filled this gap moving forward it still needs to nullify the Bear Flag formed by the top two thick red lines with a new higher high. Which also implies until then this TOPic is still unchanged.
Why did I leave other thick red lines, all together 4 of them, remained on RUT chart, wouldn't that just adding confusion? ... let me skip words, see 3 thick arrows that created the line on 4/15? and today 24days later that line suddenly shows off its power and wack the mole (thick downward arrow) like a thief. If I didn't keep the line how could I anticipate that "WHACK!"? That's why LOL have forecasting power, a legitimate system. Never mind, price is still on her way to the gap above so far, staying course until...
Enjoy if can, while I am in detailing mood...LOL!
Edited by iloli way, 09 May 2016 - 05:11 PM.
PRICE IS KING; LINE RULES! - Laws Of Line (LOL) Trading Systems
Swing Those Lines: I can calculate the motion of heavenly bodies, but not the madness of people! -- Issac Newton
Swing Those Lines: I can calculate the motion of heavenly bodies, but not the madness of people! -- Issac Newton
#16
iloli way
-
- TT Member*
-
- 4,028 posts
iloli = I'm Laws Of Line's I(eye)
Posted 10 May 2016 - 07:10 PM
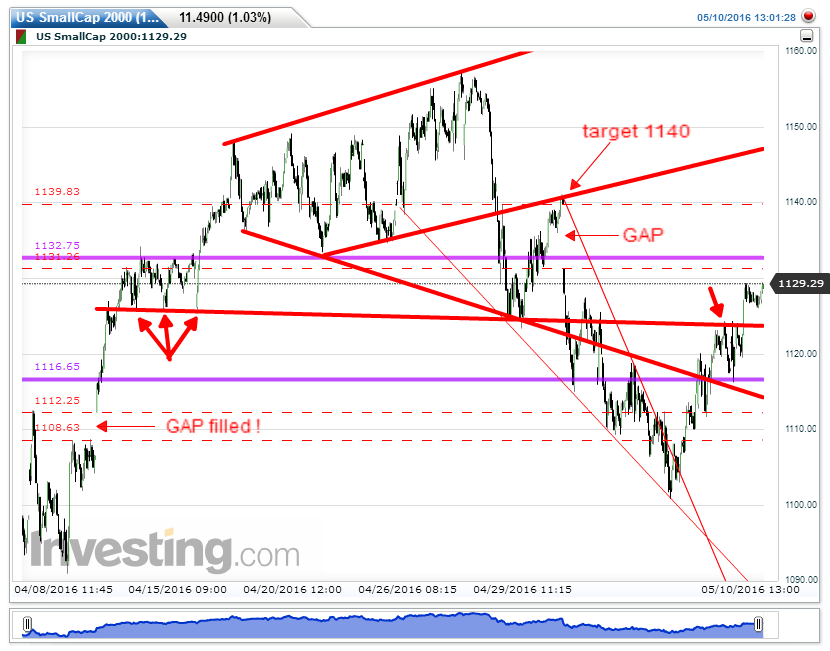
RUT : I've said and in chart a gap is still there above to be filled; it is just happen to be the 'falling wedge' upward BO target, how convenient.
ES/SPX : falling wedge BO target 2094.5...
that's how 2 read my chart.
Therefore the target of BO only goes to top of the wedge tl, which is the second highest/1140/gap top/+thick red TL convergent point, not the highest price of last top. 1140 is also where the second thick red line kissed goodbye the top of wedge last time with a gap down.
price is still on her way to the gap above so far, staying course until...
Edited by iloli way, 10 May 2016 - 07:13 PM.
PRICE IS KING; LINE RULES! - Laws Of Line (LOL) Trading Systems
Swing Those Lines: I can calculate the motion of heavenly bodies, but not the madness of people! -- Issac Newton
Swing Those Lines: I can calculate the motion of heavenly bodies, but not the madness of people! -- Issac Newton
#17
relax
-

- Traders-Talk User
- 2,224 posts
Member
Posted 11 May 2016 - 02:56 PM
backtest of es 2058-2060 going on, see what happens, thanks for the updates
#18
relax
-
- Traders-Talk User
- 2,224 posts
Member
Posted 11 May 2016 - 02:57 PM
are you seeing any magic in gold ;-)
that 1306 seems key
#19
iloli way
-
- TT Member*
-
- 4,028 posts
iloli = I'm Laws Of Line's I(eye)
Posted 11 May 2016 - 08:15 PM
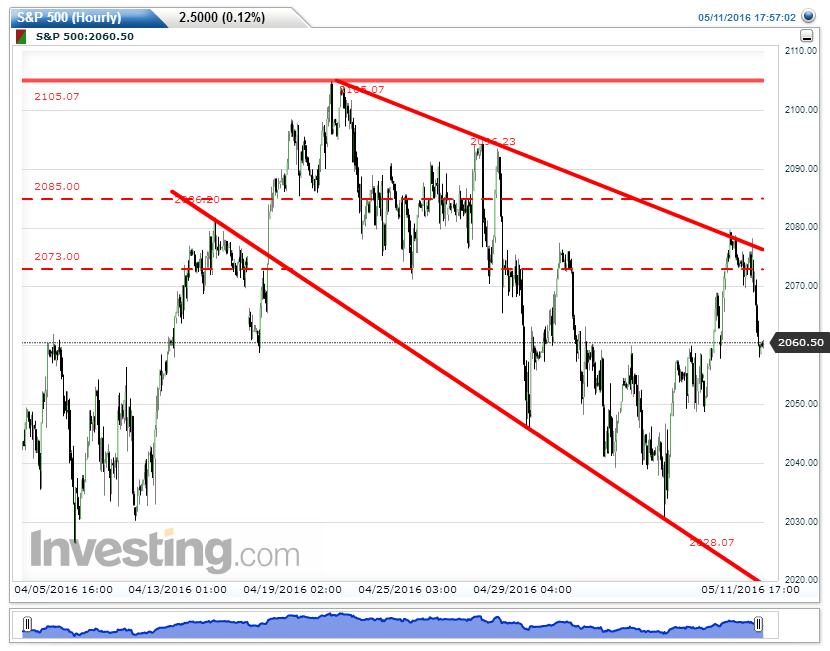
ES morphed into one of the most bullish potent pattern - the last top got dragged into picture - if upward BO, target 2105 - BD 2030 to negate. (compare with last chart, see the magic how)
PRICE IS KING; LINE RULES! - Laws Of Line (LOL) Trading Systems
Swing Those Lines: I can calculate the motion of heavenly bodies, but not the madness of people! -- Issac Newton
Swing Those Lines: I can calculate the motion of heavenly bodies, but not the madness of people! -- Issac Newton
#20
iloli way
-
- TT Member*
-
- 4,028 posts
iloli = I'm Laws Of Line's I(eye)
Posted 11 May 2016 - 08:19 PM
RUT cash: today's pull back shape like a 'Sickle', watch out for snap back up!
Chart's been simplified - bullish wedge intact, unlike ES.
PRICE IS KING; LINE RULES! - Laws Of Line (LOL) Trading Systems
Swing Those Lines: I can calculate the motion of heavenly bodies, but not the madness of people! -- Issac Newton
Swing Those Lines: I can calculate the motion of heavenly bodies, but not the madness of people! -- Issac Newton


Also tagged with one or more of these keywords: per Perfect Game
TTHQ Directory →
Fearless Forecasters →
The Truth per Perfect GameStarted by iloli way , 10 Jul 2016 |
|
|
||
TTHQ Directory →
Fearless Forecasters →
Hourly Bear Flags EVERYWHERE!Started by iloli way , 24 Jun 2016 |
|

|
||
TTHQ Directory →
Fearless Forecasters →
Spot On Again, Now What?Started by iloli way , 12 Jun 2016 |
|
|
||
TTHQ Directory →
Fearless Forecasters →
I Don't Just Call ItStarted by iloli way , 02 Jun 2016 |
|
|
||
TTHQ Directory →
Fearless Forecasters →
My New GuruStarted by iloli way , 14 May 2016 |
|
|

