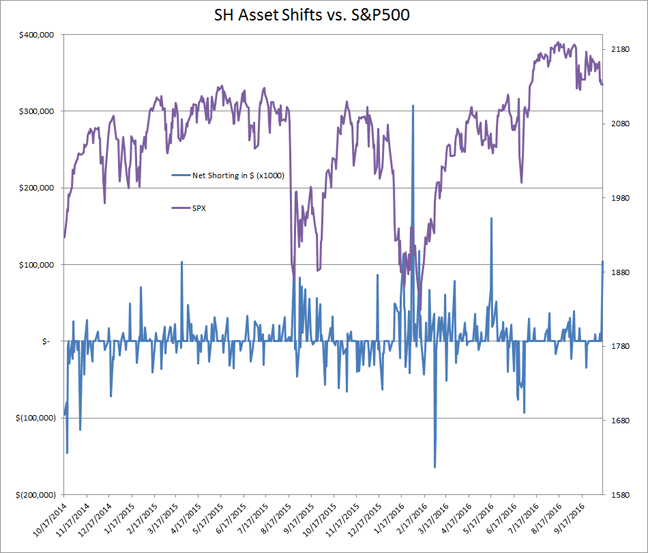
The SH is showing a very large (in context) one day increase in shorting. Take a peek at this chart. It's pretty Bullish for the market.

Mark S. Young
Posted 17 October 2016 - 09:20 AM
The SH is showing a very large (in context) one day increase in shorting. Take a peek at this chart. It's pretty Bullish for the market.
Mark S Young
Wall Street Sentiment
Get a free trial here:
http://wallstreetsen...t.com/trial.htm
You can now follow me on twitter
Member

Posted 17 October 2016 - 09:28 AM
I see the recent correction is likely ending at this juncture...........
Member

Posted 17 October 2016 - 09:31 AM
Mark, can you share where that chart comes from, or if not where one could obtain this data?
Mark S. Young
Posted 17 October 2016 - 10:37 AM
I run the raw data from Profunds.
Mark S Young
Wall Street Sentiment
Get a free trial here:
http://wallstreetsen...t.com/trial.htm
You can now follow me on twitter
Member

Posted 17 October 2016 - 11:50 AM
Mark - looks like they caught it pretty right last year in March and December?
Mark S. Young
Posted 17 October 2016 - 02:15 PM
Mark - looks like they caught it pretty right last year in March and December?
Yup. $100MM is my daily threshold. The Buys work well, as you can see, though the sells are far trickier.
The 7- and 21-day cumulatives are useful too, but they're more contextual.
Mark
Mark S Young
Wall Street Sentiment
Get a free trial here:
http://wallstreetsen...t.com/trial.htm
You can now follow me on twitter


