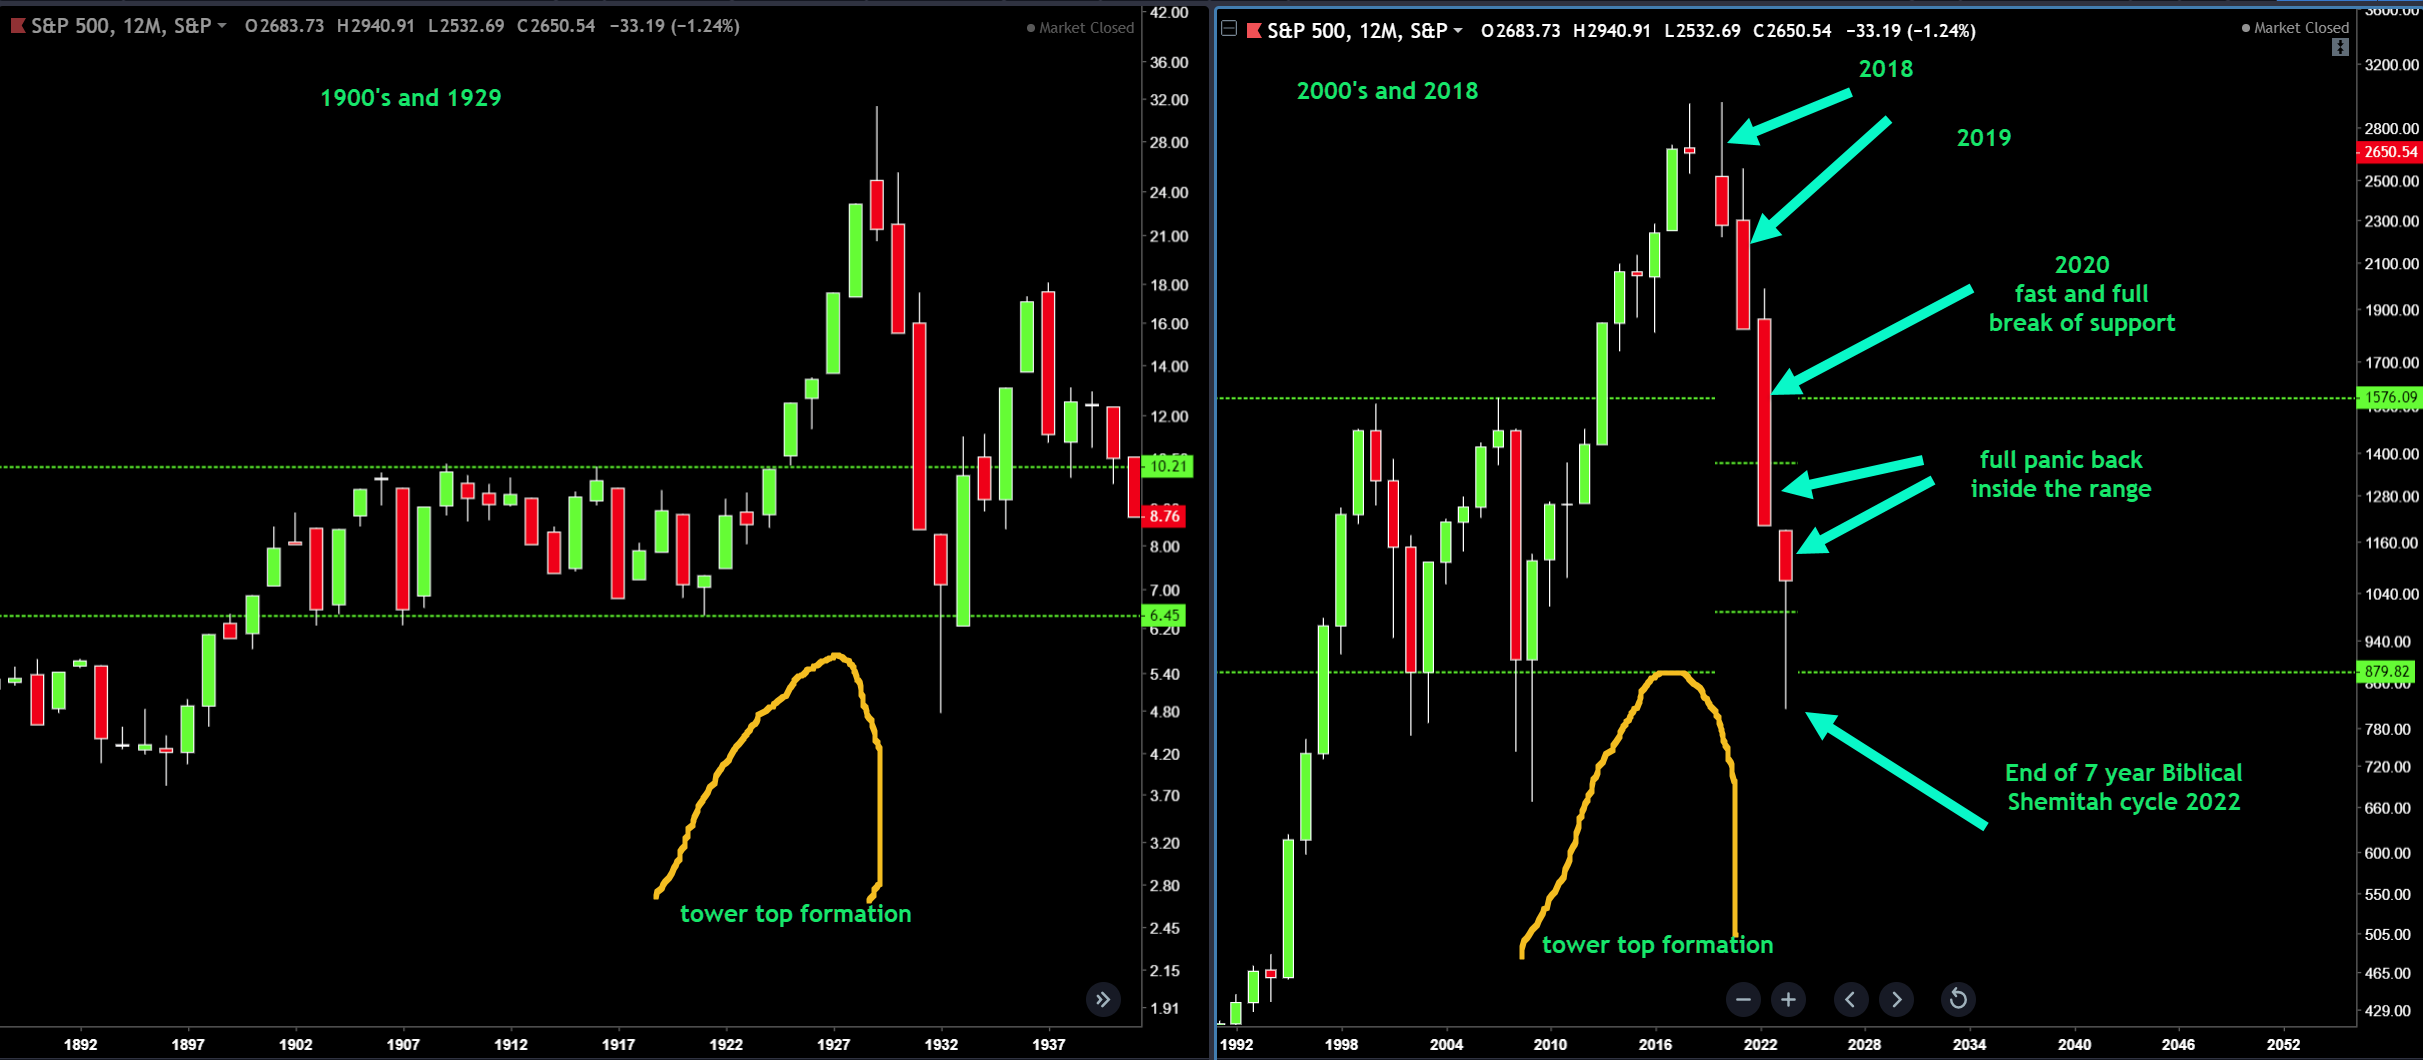
Supposedly this Shemitah cycle ends its 7 years in 2022. And I think this one is the 7th for a total of 49 years. I guess that makes this a Jubilee year. I don't normally incorporate Biblical cycles into my technical analysis, but it sure is scary to think that we are now embarking on the final 4 years of this Shemitah cycle. Generally speaking, I suppose that means a total cleansing of debt, a complete wipeout of the stock market and a financial return to normalcy whatever that means.
But it is interesting and scary at the same time if we overlay the 1929 yearly price bars and the 2018 yearly price bars. Right now the 2018 yearly bar is printing a shooting star candle. Shooting star candles can morph into much more bearish reversal candles.
Note also that from the LOW of end of the 1920s bear market ( 1932 ) to the recent high of 2018 is 86 YEARS. Divide by 10 that is the 8.6 year armstrong cycle matching that bear market low to the 2018 high.
There are 2 weeks left in the formation of the 2018 yearly price bar. A heavily BEARISH outcome for the next TWO WEEKS could potentially close the 2018 yearly bar MID RANGE into last years price candlestick. This would be the most ominous situation IMO as it could foretell what 2019 price action may look like.
If you just glance at the chart it would seem to be absurd to expect the market to continue up another 2 to 4 years with big yearly up price bars. Anything is possible however that is pushing the edge of probability.
I don't show RSI on the yearly price chart but note that if 2018 closes more negative (maybe 2500 or so) it is going to invoke a CLASS C bearish divergence between yearly RSI and yearly price on the sp500. This is the most bearish type of divergence and implies rapid price weakness on a yearly basis for several years.
This looks like a very dangerous market to me and I think most people do not truly realize what may be coming going into 2022. (ie. worsening tariffs and trade wars that lead to real wars, that lead to supply disruptions, food shortages, economic decline, real estate decline, skyrocketing taxes and fees etc. etc.)
We are at the cusp of a FOUR YEAR persistent bear market which almost no one is talking about or expecting. And price may fall UNDER the year 2000 price trading range.
Let that sink in for a minute. Look at the chart and tell me it is not true. Because if it is true then it is a PROFOUND statement. Because then it means that with each really along the way more and more bulls will be sucked back in and wiped out to the eventual final near 2022.
Edited by tradesurfer, 13 December 2018 - 07:58 PM.