Jump to content


Photo

Shiny Happy People Cheering Stocks’ New Highs: HINDENBURG OMEN!


  • Please log in to reply
28 replies to this topic

#1 dTraderB

dTraderB

    Member

  • Traders-Talk User
  • 17,455 posts

Posted 18 November 2019 - 08:16 PM

92% SHORT, which is basically almost FULL SHORT

Good column at link below

Shiny Happy People: Investors Cheering Stocks’ New Highs

Options Traders at Optimistic Extreme

111819_CBOEPutCallRatio.png?itok=2N-4zTw

Source: Charles Schwab, Bloomberg, as of 11/15/2019. 

Smart vs. dumb money  

Finally, one of my favorite sentiment indicators—and one of the most popular ones I show in my writings or in client presentations—is constructed by SentimenTrader (ST) on a daily basis. The Smart Money and Dumb Money Confidence indices are a unique innovation that show what the “good” market timers are doing with their money compared to what “bad” market timers are doing.

ST’s Confidence indices use mostly real-time gauges—there are few opinions involved in them. Generally, you want to follow the Smart Money traders when they reach an extreme and do the opposite of what the Dumb Money traders are doing when they are at an extreme. 

Examples of some Smart Money indicators include the OEX put/call and open interest ratios, commercial hedger positions in the equity index futures and the current relationship between stocks and bonds. Examples of some Dumb Money indicators include the equity-only put/call ratio (like shown above), the flow into and out of the Rydex series of index mutual funds, and small speculators in equity index futures contracts. 

Because the “dumb money” follows trends, and the “smart money” generally goes against trends, the “dumb money” is usually correct during the meat of the trend. However, when it becomes too positive, and sentiment has reached an extreme, stocks typically run into trouble. That has historically typically happened when Dumb Money Confidence rose above 60% and Smart Money Confidence has fallen below 40%.

Well, see below. Clearly, we are at one of those historical extremes. As of Friday, the five-day average of the Smart Money/Dumb Money Confidence spread has moved below -60%. In the past decade, this happened on 55 days, leading to further gains for the S&P 500 over the next two months after only 20 of them (a low 36% “win rate”), with a median return of -3.0%.

“Dumb Money” & “Smart Money” at Opposite Extremes

111819_SmartDumbMoney.png?itok=JHxWXfN2

Source: Charles Schwab, SentimenTrader, as of 11/15/2019.

In sum  

For the past near-two years we have been pointing out the confluence of uncertainties that have meant the market could “go either way”—including most obviously trade/tariffs, but also the related economic trajectory, Fed policy and geopolitical/political uncertainty. It has led to a wide trading range—the peaks and valleys of which have been driven as much by extremes in sentiment as they have by the changing dynamics of the underlying fundamentals. In light of that, and the extremes of sentiment we are witnessing again, investors should not view the market’s latest high with rose-colored glasses.

https://www.schwab.c...tocks-new-highs


#2 dTraderB

dTraderB

    Member

  • Traders-Talk User
  • 17,455 posts

Posted 18 November 2019 - 08:18 PM

I really haven't followed this HINDENBURG thing but ST has been tracking it ...


SentimenTraderVerified account @sentimentrader
FollowFollow @sentimentrader
More

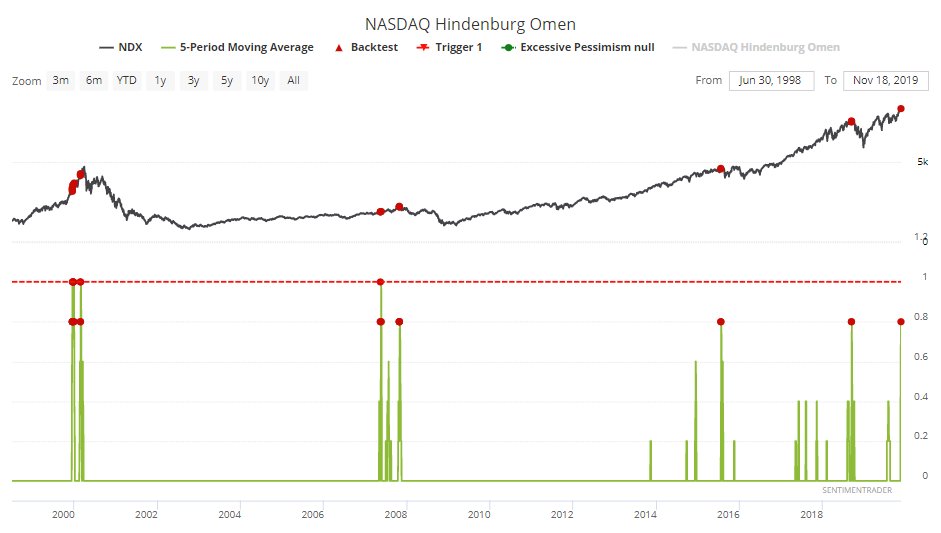
On the Nasdaq, the last 4 days have triggered a Hindenburg Omen. Here is every instance over the past 20 years when at least 4 of 5 days triggered a signal. All 28 days showed a negative return either 3, 6, or 12 months later.

EJsT4vRXsAEseT9.jpg
3:32 PM - 18 Nov 2019


#3 dTraderB

dTraderB

    Member

  • Traders-Talk User
  • 17,455 posts

Posted 18 November 2019 - 08:22 PM

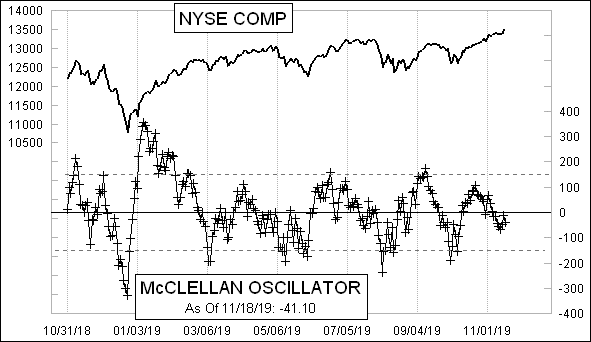
McClellanOsc_672.gif


Still below zero


and Summation here:

https://www.marketin...summation-index


#4 dTraderB

dTraderB

    Member

  • Traders-Talk User
  • 17,455 posts

Posted 18 November 2019 - 08:24 PM

NAAIM down?


http://www.naaim.org...exposure-index/


#5 dTraderB

dTraderB

    Member

  • Traders-Talk User
  • 17,455 posts

Posted 18 November 2019 - 08:35 PM

I glance at these charts every day and try to interpret but never get down to learning more about it


Stephen Harlin @nextSignals
FollowFollow @nextSignals
More

Segmented Auction suggests a down Tuesday.

EJsrMKZWwAEt_7E.png
5:14 PM - 18 Nov 2019


#6 da_cheif

da_cheif

    Member

  • Traders-Talk User
  • 10,962 posts

Posted 18 November 2019 - 08:35 PM

wassat tellya....no euphoria there eh     ....snort.....watch the sky


#7 12SPX

12SPX

    Member

  • Traders-Talk User
  • 12,583 posts

Posted 19 November 2019 - 08:48 AM

I'm very surprised to wake up to another up day in the futures.  Pooooor market, I'm starting to feel bad for it as its setting itself up for a huge fall here.  In this day and age I'm just shocked why this continues to happen.  I love new highs believe me but without volatility its fake news lol!!  Even the chief can't deny this thing is running on fumes since 3105 lol!  


#8 OEXCHAOS

OEXCHAOS

    Mark S. Young

  • Admin
  • 22,022 posts

Posted 19 November 2019 - 09:41 AM


I view 90% exposure as an IT warning sign. We backed below that level as we rallied. I viewed that as Bullish or at least anti-Bearish.


Mark S Young
Wall Street Sentiment
Get a free trial here:
http://wallstreetsen...t.com/trial.htm
You can now follow me on twitter


#9 K Wave

K Wave

    Member

  • Traders-Talk User
  • 26,862 posts

Posted 19 November 2019 - 09:59 AM

That is one Ugly opening 30 min candle on Dow....


The strength of Government lies in the people's ignorance, and the Government knows this, and will therefore always oppose true enlightenment. - Leo Tolstoy


#10 Darris

Darris

    Member

  • Traders-Talk User
  • 1,667 posts

Posted 19 November 2019 - 12:04 PM

The HO for the Naz that Jason reported seems to be low vs what Barron's Market Diary reports.  They show 7 consecutive days as of Monday close, with November 7th missing by a couple of new lows, and today will make 8 consecutive since it is already only a few issues from showing.  The NYSE continues to show no HO triggers, but Naz clusters are valid for some near term weakness.  The record consecutive since 1990 was in the summer of 1990 with 18, however stock charts history for unchanged issues is only good from around 2002 and that missing data in the total affects the NH/NL trigger percents.  Other meaningful clusters were triggered leading into the 4th qtr drop in 2007, July 2015, Oct 2015, Aug-Oct 2018, July 2019.  Without NYSE non-common weakness the HO will probably not work very well this time.


Date .......NZ up ....NZ Dn.. NZ Unch NZ 52H NZ 52L NH%.... NL% ....Ratio. HO Tot
11/07/19.. 1651.... 1,519 ....138 .........214...... 91....... 6.47%... 2.75%. 2.35... 0.... 0
11/08/19.. 1662.... 1,474 ....111.......... 98....... 97....... 3.02%... 2.99%. 1.01... 1..... 1
11/11/19 ..1438.... 1682 .....102.......... 91....... 95....... 2.82%... 2.95%. 0.96... 1..... 2
11/12/19.. 1568.... 1,570 ....120........ 152..... 107...... 4.67%... 3.28%.. 1.42... 1..... 3
11/13/19.. 1336.... 1800 .....121........ 106..... 126...... 3.25%... 3.87%.. 0.84... 1..... 4
11/14/19.. 1425.... 1724 .....122......... 97 ......120...... 2.97%... 3.67%.. 0.81... 1..... 5
11/15/19.. 1888.... 1257.......123....... 168..... 115...... 5.14%... 3.52%.. 1.46... 1..... 6
11/18/19.. 1374.... 1797..... 124........ 169..... 132...... 5.13%... 4.01%.. 1.28... 1..... 7
11/19/19.............................................................................................................1.....8
11/20/19