
The flatlines say...
#1

Posted 17 December 2019 - 03:44 PM
"If you've heard this story before, don't stop me because I'd like to hear it again," Groucho Marx (on market history?).
“I've learned in options trading simple is best and the obvious is often the most elusive to recognize.”
"The god of trading rewards persistence, experience and discipline, and absolutely nothing else."
#2

Posted 17 December 2019 - 03:49 PM
The patient is dead?
#3

Posted 17 December 2019 - 04:22 PM
#4

Posted 17 December 2019 - 05:04 PM
Yet, the pattern suggests another gap up tomorrow?
#6

Posted 17 December 2019 - 06:15 PM
On TQQQ......price hasnt done didely squat yet in December. Should reach 3 percent above the 15 min upwave......big zippo on that one. Around 5 percent or more above the 5 min 200 ma.......a massive zippo on this one. Shoot, 9 percent above the 5 min 200 would get the gold medal, and were struggling to just get to 4 percent. Its still market maker Amateur hour here......
tqqq hasnt what? https://c.stockchart...r=1576624405380
#7

Posted 17 December 2019 - 06:37 PM
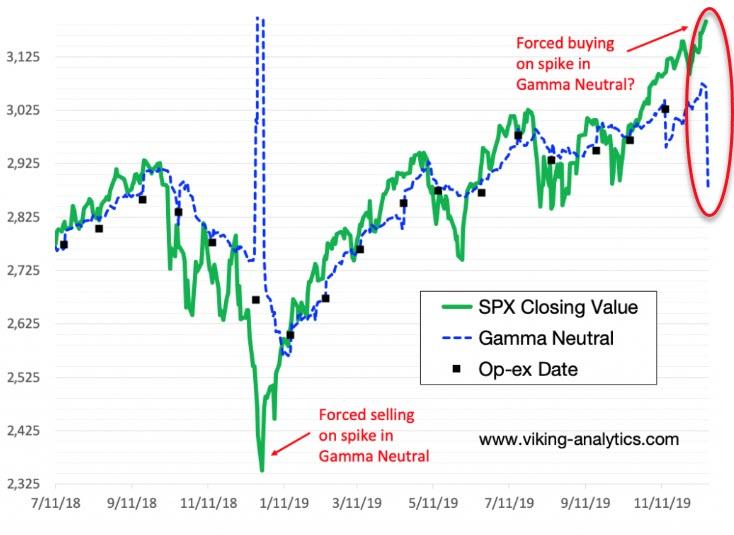
The gamma neutral data does indicate a possible short covering move for the SPX, but I will remain flat. Waiting to see how it plays out.... Will the call sellers be forced to cover? We shall see, but for now the trend remains up.
https://viking-analytics.com/why
https://www.investin...utral-200490061
Good Trading!
Daily.... remain long.....
https://stockcharts....268&a=707467302
Edited by robo, 17 December 2019 - 06:44 PM.
" “There is only one side to the stock market; and it is not the bull side or the bear side, but the right side” Jesse L. Livermore
#8

Posted 18 December 2019 - 12:53 PM
Every professional investor knows that month-ending, quarter-ending and year-ending timestamps are important. Throughout the year, positions are hedged against these timestamps, and as a result, the year-ending option expirations almost always have the highest open interest. Generally, the higher the open interest the greater the volatility and financial risk.
Last December, in and around the final option expiration of the year, the S&P 500 fell by nearly 300 points. This dramatic decline coincided with a spike in market gamma as shown below. It is my view that this decline was furthered by forced selling by the put sellers who needed to sell the S&P 500 index to cut their losses.
As we approach this year and the S&P 500 continues to grind higher, we may be facing the inverse of last year. Call sellers are beginning to feel more pain, as evidenced by a first-time spike in Forecast Gamma Neutral in my December 17th report. While I am not saying that stocks will melt up through the remainder of the year, the possibility of that scenario playing out is looking more likely. The chart below shows the relationship between the cash value in the SPX and the metric that I call Gamma Neutral.
SPX Value versus Prompt-Month Gamma Neutral
Edited by robo, 18 December 2019 - 12:54 PM.
" “There is only one side to the stock market; and it is not the bull side or the bear side, but the right side” Jesse L. Livermore
#9

Posted 18 December 2019 - 04:31 PM
#10

Posted 18 December 2019 - 05:05 PM
My fractal work seems to suggest one more push upward to complete wave-c:x:2... watching.


