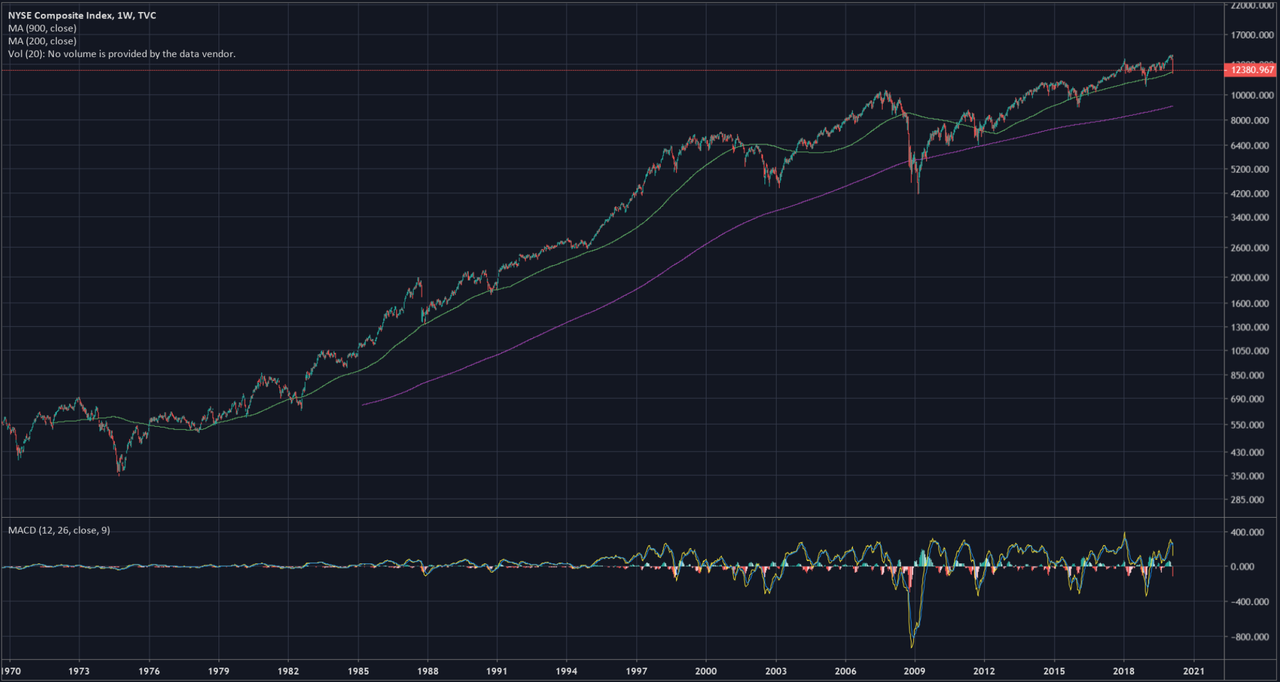
Here's a 50 year logarithmic look at New York Composite monthly.
It is pretty clear that 200 month MA is pretty important to bull health.
With that apparent breakout/fakeout reversal in Feb, it is no time to be complacently long, despite what appears to a panic low on Friday.
If we get continuation, and Feb turns out to be first of 3 Black (red in the age of color) Crows, then it would become increasingly likely that this long bull run has ended, and the the NYA is about to essentially fall of a cliff after a long slowing of the angle of ascent while running out of gas, perhaps similar to 1973-74
But if we get a powerful reversal off of Friday's low that keeps grinding upwards back above 13K, then there is likely more bull still to come, and we might only be halfway done from the 2009 low.
At this point, it "looks" more bearish than bullish to me, but until the MACD gets below zero line, bulls can still save it.
Next few months look very pivotal to the longer term pic here. Looks like it is pretty much step on the gas out of Friday's low area and accelerate upside, or rollover and die.
Anyway, hopefully some will find this look helpful.