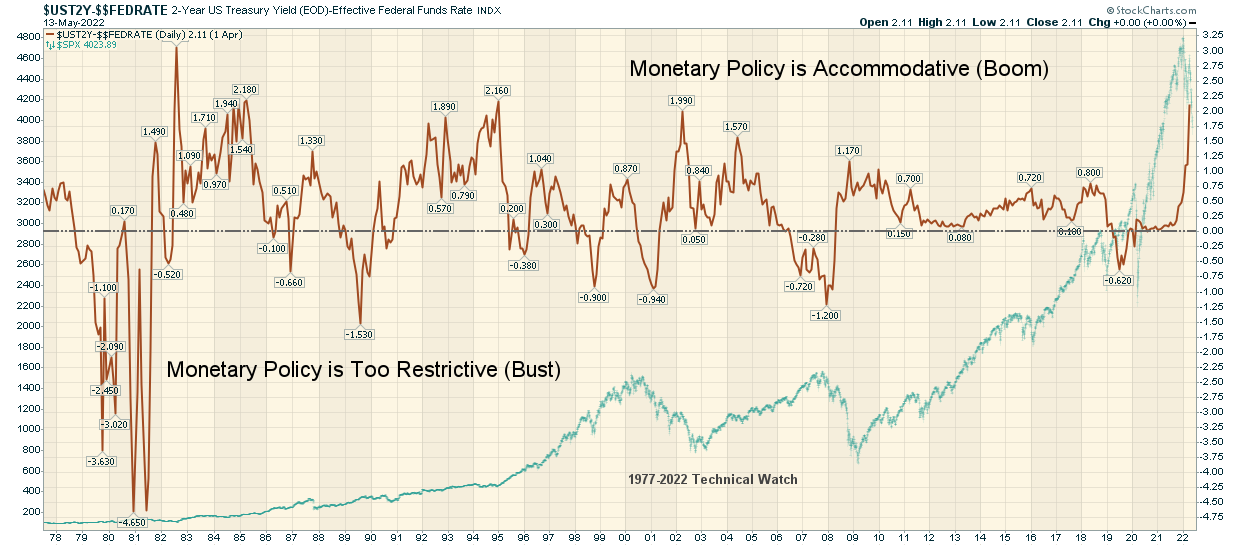
Below is my "Boom/Bust" chart that measures the spread between the 2 year note and the Fed Funds Rate. Right now, the Fed continues to be very slow in raising its target rates which is providing excess stimulus to the financial markets (and probably why savings rates aren't moving higher with each increase). This is potentially good news for the longer term bulls on a historic basis, but it's also bad news for the intermediate term in that this keeps the rate of inflation "hot", the buying and selling of consumer goods and services stagnant, with lower business profits and earnings as a result.
Bottom line, the quicker we see the Fed raise rates to match the yield on the 2 year note, the quicker that equities will find a tradable bottom. Looking at the past, the lag time here could be months away.
At least that's the fundamental theory behind this.
Other opinions are most welcomed as fundamentalism is really not my forte.
Fib