Jump to content


Photo

BULLISH EOM & EOQ --- Bears ready to pounce....


  • Please log in to reply
156 replies to this topic

#1 dTraderB

dTraderB

    Member

  • Traders-Talk User
  • 17,212 posts

Posted 20 June 2022 - 08:32 PM

Sentiment was so negative that by default there could be a rally


So, my FF is an UP week into the end of June and end of Q 2.


But, this is a DIFFERENT market environment and anything can happen


My objective is to add another 3 to 5 % to my account for the 6th consecutive profitable month


I was hesitant and went into RISK OFF mode last week, and will continue this week, 


Quite possibly, I nay close most or all my LONGS * HEDGE SHORTS on a good day & this end the month & quarter on that note. 


Markets are up tonight and could rally even more tomorrow for at least a 2% gain. That will be enough for me to close LONGS & HEDGES - anytime during the day or at end of day 


#2 dTraderB

dTraderB

    Member

  • Traders-Talk User
  • 17,212 posts

Posted 20 June 2022 - 08:44 PM

... and yes, BEARS are still on the prowl and ready to pounce.


will SHORT USD/YEN above 135.5 


Early 1pm close today. Likely holiday chop day. #ES_F remains basing between 3715-3635 & this range will result in 100+ point breakout move. All inbetween = noise Plan: 3675 support. As long as bulls hold, break to 3755, 3795+ in play. 3675 fails, we retest 3625-35, gate to 3500
Quote Tweet


ZVBuToeP_mini.jpg
 
Adam Mancini
 
@AdamMancini4
· Jun 18
Have a great weekend!#ES_F ultimately likely headed to 3500, but since April, its sold in a perfect downtrend channel. Support hit Thurs: if ES to bounce 1st, its here Next Week: As long as 3660-30 holds, run to 3850, 3900 gap fill in play. Warning: 3630 fails, 3500 comes direct


#3 dTraderB

dTraderB

    Member

  • Traders-Talk User
  • 17,212 posts

Posted 20 June 2022 - 08:49 PM

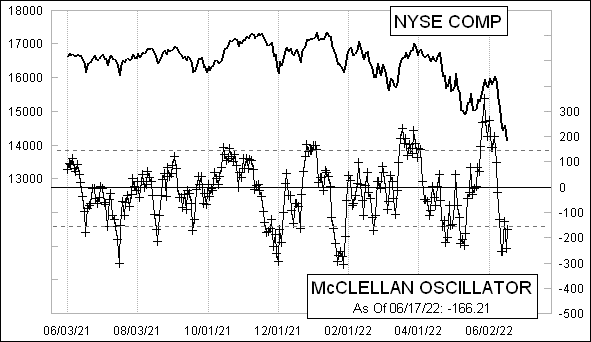
Too soon to indicate a sustainable reversal but a day or two up could turn it positive


McClellanOsc_1324.gif


https://www.mcoscill...t_breadth_data/


#4 dTraderB

dTraderB

    Member

  • Traders-Talk User
  • 17,212 posts

Posted 20 June 2022 - 08:51 PM

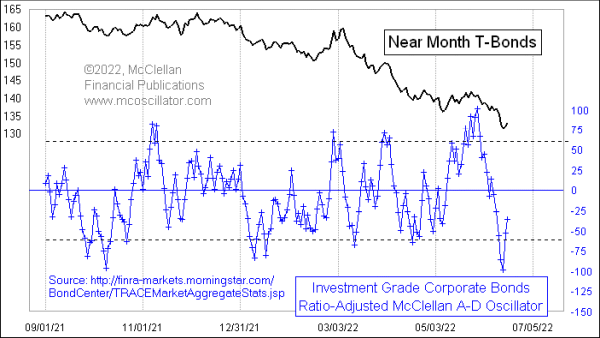
Still holding all TLT CALLS -- the TLT CALL trade has been one of my most profitable in Q2


Corporate Bonds Show Oversold Condition For T-Bonds
 

corp_bond_a-d_osc_june2022.gif


June 17, 2022


#5 dTraderB

dTraderB

    Member

  • Traders-Talk User
  • 17,212 posts

Posted 20 June 2022 - 08:55 PM

I may actually SHORT this NEW short BITCOIN ETF!  BITCOIN bear market rally could REACH  40K 


Bought $BTC around 18.2K first time Crypto was the dotcom bubble of 20s, bear market rallies will be similar too, maybe more violent During dotcom collapse, 30% to 40% bear market rallies were the norm, $BTC can do 50-100% First one starting from right below 2017 high imo


There comes Bitcoin $40K
Quote Tweet


fJq985Yf_mini.png
 
CNBC
@CNBC
· 6h
ProShares is launching a short bitcoin ETF this week https://cnb.cx/3Obvno4


#6 dTraderB

dTraderB

    Member

  • Traders-Talk User
  • 17,212 posts

Posted 20 June 2022 - 08:57 PM

Investors right now are ‘uber-bearish,’ BofA says


It’s a bear stampede on Wall Street.


Bank of America Research analysts said in a report on Thursday that positioning among investors was “uber-bearish,” as stocks continued to take a pummeling.

The investment bank’s Bull & Bear Indicator—which gives a gauge of sentiment among traders—fell to 0.0 on Thursday from 0.3 a week earlier.

The indicator previously ticked down to zero in previous moments of extreme economic anxiety, BofA said. It previously fell to its lowest level in August 2002 (the dotcom bubble bursting), July 2008 (the Great Recession), September 2011 (the European debt crisis), September 2015 (when China’s economy faltered), and March 2020 (the arrival of COVID in the U.S.).

https://fortune.com/...stocks-markets/


#7 dTraderB

dTraderB

    Member

  • Traders-Talk User
  • 17,212 posts

Posted 20 June 2022 - 09:05 PM


tD5DYvYR_normal.jpg
 
After 10 of 11 weeks lower and $SPX oscillator near the March 2020 lows, some type of oversold rally can't be ruled out, but I'm not trying to find counter-trend downtrend rallies.


tD5DYvYR_normal.jpg
 
After 10 of 11 weeks lower and $SPX oscillator near the March 2020 lows, some type of oversold rally can't be ruled out, but I'm not trying to find counter-trend downtrend rallies.


#8 dTraderB

dTraderB

    Member

  • Traders-Talk User
  • 17,212 posts

Posted 20 June 2022 - 09:11 PM

ZEROHEDGE  tweet: smart money flow index reversal


Could it be...

https://twitter.com/...866876818182149


#9 dTraderB

dTraderB

    Member

  • Traders-Talk User
  • 17,212 posts

Posted 20 June 2022 - 09:14 PM

Are You Prepared For A Major Bottom? This Is It
Tom Bowley |  June 19, 2022 at 02:58 PM


Note that the current cyclical bear market shows from top to bottom that the S&P 500 has fallen 24.52%, which right now ranks it as the 9th worst bear market since 1950. Most analysts would agree that the bottom isn't in yet, so this decline is only going to get worse. I'm not among "most analysts", as I called the low this past week THE bottom. For me, it's not about being right or wrong. Instead, I'm trying to manage my risk - not only when the market tops, but also when it could be bottoming or approaching a bottom. Look at those 1-year returns after bear market lows. If you can avoid being in the stock market during big declines (which we've done in 2022) and then invest when much of the risk has passed, those 1-year, post-bear-market returns paint quite a nice picture.

https://stockcharts....ajor-b-520.html


#10 dTraderB

dTraderB

    Member

  • Traders-Talk User
  • 17,212 posts

Posted 20 June 2022 - 09:19 PM

Fed Bluffs And Wall Street Calls


With the market completing a “head and shoulders” topping process and violating important support at the 38.2% Fibonacci retracement level, the next logical support is 3500. Such a correction would wipe out all the gains since the 2020 peak. Such would also push the S&P 500 index nearly 4-standard deviations below the 50-day moving average.

If the market fails to find support at 3500, 3196 becomes the next logical level.

However, the market is currently showing several signals aligned with previous market bottoms. Currently, only 2.6% of stocks in the S&P 500 index are trading above their 50-day moving average. Moreover, only 12.4% are above their respective 200-dma. As shown, with the market oversold and so many stocks trading below their respective moving averages, such typically denotes market lows.

Stocks-above-their-50-and-200-dma.png

Furthermore, the market selling as of late has been brutal. As noted by BofA:

“More than 90% of stocks in the S&P 500 declined today. It’s the 5th time in the past 7 days. Since 1928, there have been exactly 0 precedents. This is the most overwhelming display of selling in history.”

While none of this data “guarantees” a market bottom is near, history suggests the odds of a reflexive rally remain elevated. We also suspect Wall Street will call the “Fed bluff” on aggressive monetary policy sooner than later.

https://realinvestme...ll-street-calls