Edited by redfoliage2, 15 August 2022 - 02:45 PM.
ES 4250-4300 Resistance - Pullback, then up into end of AUGUST
#41

Posted 15 August 2022 - 02:45 PM
#42

Posted 15 August 2022 - 03:48 PM
I don't know how to mutilply in StockCharts.
#43

Posted 15 August 2022 - 04:05 PM
I may have misunderstood the question. If I own a share of aapl denominated in US dollars and I want to know its relative value on the world market then I multiply its price by the relative value of the dollar.
#44

Posted 15 August 2022 - 07:38 PM
Lot of folks in TWITTER and elsewhere think the market is OVERBOUGHT and due for a reversal.
I do not trade OVERBOUGHT OR OVERSOLD indicators since they are not exact enough and could represent only a momentary condition that can disappear fter a tick or two or three....
However, I agree the markets are VERY EXTENDED above ES4300. Trading at and above ES 4300 today was not as active as below 4300.
MY initial target zone was ES 4250 to 4300 and it remains so; hence, I expect a reversal.
However, with so many traders also saying the markets will reverse here ... I will not be surprised if ES 4325 is traded, then reversal, and trap many who had expected the 4300 reversal. Markets do not do what MOST EXPECT IT TO DO, especially a crowded platform chock full of BULLS or BEARS.
#45

Posted 15 August 2022 - 07:46 PM
I added more PUTS today - QQQ, SPY, AAPL, TESLA, IWM
TLT CALLS, UVXY CALLS -- two of my favorite and most profitable trades this year.
Finally, in mid August, I am getting into RISK ON mode as the markets have rallied to the point where there is a high probability of a reversal. Markets looked exhausted above ES 4300. But, a brief pause & pullback can reenergize it to advance higher.
I took a loss in the first 2 TESLA PUTS when TESLA traded above the 925 level. Main reason was the almost certain rapid erosion of the PUT value if I kept it much longer and the stock increased. At that point in the Option Premium Curve I prefer to close it and reinvest in another option or stock etc.
#46

Posted 15 August 2022 - 07:52 PM
Well, since TOM says so then I have to take note and be ready for a reversal or at least a pause:
Lot of folks in TWITTER and elsewhere think the market is OVERBOUGHT and due for a reversal.
I do not trade OVERBOUGHT OR OVERSOLD indicators since they are not exact enough and could represent only a momentary condition that can disappear fter a tick or two or three....
However, I agree the markets are VERY EXTENDED above ES4300. Trading at and above ES 4300 today was not as active as below 4300.
MY initial target zone was ES 4250 to 4300 and it remains so; hence, I expect a reversal.
However, with so many traders also saying the markets will reverse here ... I will not be surprised if ES 4325 is traded, then reversal, and trap many who had expected the 4300 reversal. Markets do not do what MOST EXPECT IT TO DO, especially a crowded platform chock full of BULLS or BEARS.
#47

Posted 15 August 2022 - 07:57 PM
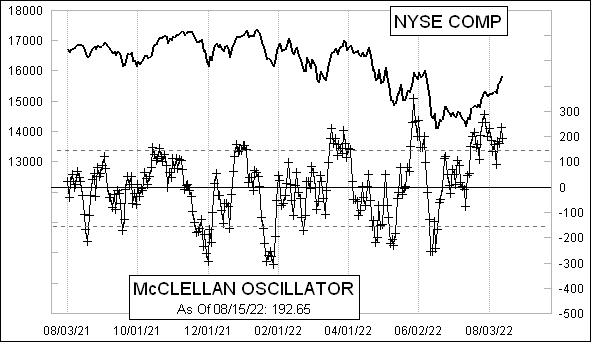
ABOVE ZERO still but DOWN TODAY... reflects a market rallying but losing energy and could roll over\\\

NYSE: 08/15/2022 Issues Volume(000s) Advances 1625 1724061 Declines 1583 1919688 Difference 42 -195627 10% Trend 619 . 015 911324 5% Trend 426 . 367 577904 McC OSC 192 . 648 333420 PRIOR McC OSC 236 . 531 415702 SUMM Index 3529 . 834 2778261 PRIOR SUMM Index 3337 . 186 2444842
https://www.mcoscill...t_breadth_data/
#48

Posted 15 August 2022 - 07:58 PM
SPX also slightly down
https://www.marketin...summation-index
ABOVE ZERO still but DOWN TODAY... reflects a market rallying but losing energy and could roll over\\\
NYSE: 08/15/2022 Issues Volume(000s) Advances 1625 1724061 Declines 1583 1919688 Difference 42 -195627 10% Trend 619 . 015 911324 5% Trend 426 . 367 577904 McC OSC 192 . 648 333420 PRIOR McC OSC 236 . 531 415702 SUMM Index 3529 . 834 2778261 PRIOR SUMM Index 3337 . 186 2444842
#49

Posted 15 August 2022 - 07:59 PM

#50

Posted 15 August 2022 - 08:12 PM
Well, since CARL also thinks so then it is even more probable there will be a reversal this week
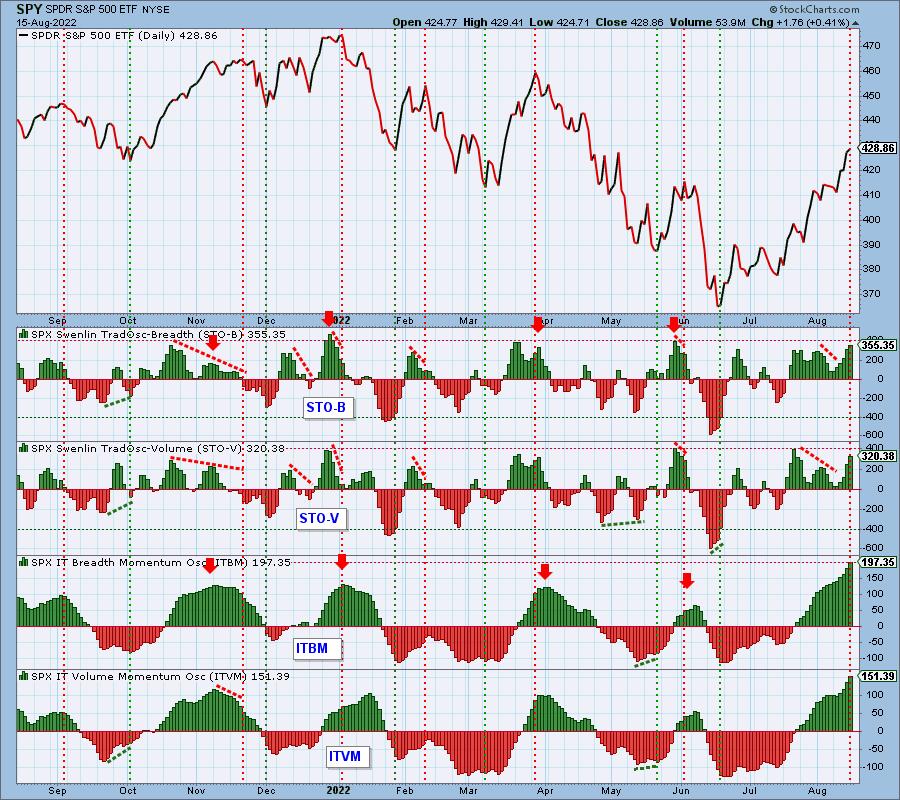
"It occurred to me that some of our primary indicators have created a teachable moment. Specifically, our short-term and intermediate-term indicators are both at fairly extreme overbought levels, and now is a good time to talk about what that means.
The Swenlin Trading Oscillators for breadth and volume (STO-B and STO-V) are near the top of their normal range, and that usually coincides with short-term price tops. The IT Breadth and Volume Momentum Oscillators (ITBM and ITVM) are also near the top of their normal ranges, and that normally coincides with intermediate-term price tops. With indicators from both time frames at overbought levels, there is strong technical pressure for prices to make a noticeable decline.

Conclusion: This condition occurs about every two to three months (see the red, downward pointing arrows for previous events), and it is fairly reliable as a top warning. While all four indicators are still rising, they are quite extended, so I would expect a price top soon, probably this week. Not guaranteed, just likely."
https://stockcharts....t-looks-13.html
Well, since TOM says so then I have to take note and be ready for a reversal or at least a pause:
Stock market has had a good run, but is now arguably overbought. SP500 is extended well above its 50EMA. This chart shows that in a tricky way. Choose PPO as an indicator, then set parameters as (1,50) to show percent deviation from that EMA. Most overbot since just after Covid.
Lot of folks in TWITTER and elsewhere think the market is OVERBOUGHT and due for a reversal.
I do not trade OVERBOUGHT OR OVERSOLD indicators since they are not exact enough and could represent only a momentary condition that can disappear fter a tick or two or three....
However, I agree the markets are VERY EXTENDED above ES4300. Trading at and above ES 4300 today was not as active as below 4300.
MY initial target zone was ES 4250 to 4300 and it remains so; hence, I expect a reversal.
However, with so many traders also saying the markets will reverse here ... I will not be surprised if ES 4325 is traded, then reversal, and trap many who had expected the 4300 reversal. Markets do not do what MOST EXPECT IT TO DO, especially a crowded platform chock full of BULLS or BEARS.
Stock market has had a good run, but is now arguably overbought. SP500 is extended well above its 50EMA. This chart shows that in a tricky way. Choose PPO as an indicator, then set parameters as (1,50) to show percent deviation from that EMA. Most overbot since just after Covid.


