He said:
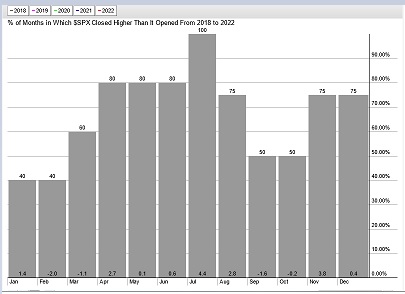
Seasonality: Go Away in Late August
Started by Rogerdodger, Jul 30 2022 10:28 AM
Stockcharts overall August going into September & October also looks weak.
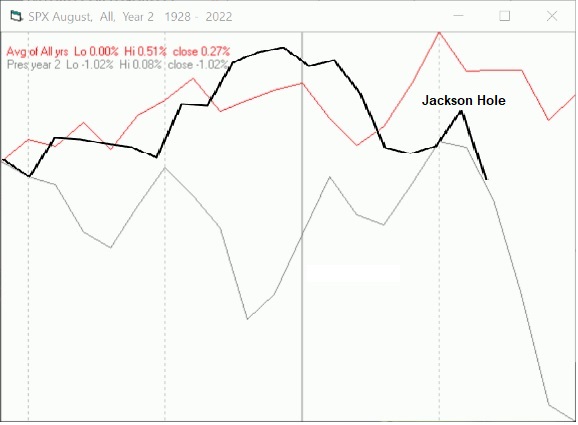
With SPX monthly, currently down -1.3%, Mike Burk's -1.02% August chart is making a "nice rhyme this time" with 3 days and 1 hour to go...
.
Edited by Rogerdodger, 26 August 2022 - 02:31 PM.