Zweig Breadth Thrust
Is there a symbol on stockcharts.com that can provide this?
Does this indicator use the 10 day simple or the 10 day exponential moving average?
Thank you in advance.

Zweig Breadth Thrust
Started by
Waver
, Oct 06 2022 05:01 AM
7 replies to this topic

#3

fib_1618
-

- Traders-Talk User
- 10,145 posts
Member
Posted 06 October 2022 - 10:15 AM
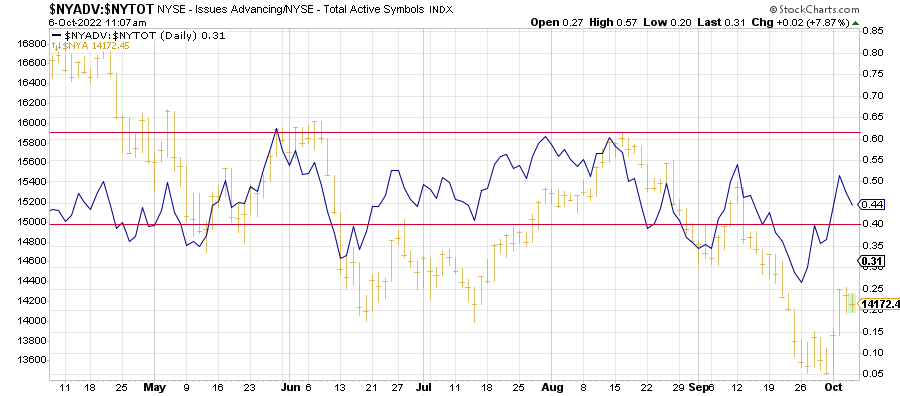
First chart is using a 10 day EMA...now on day 4.
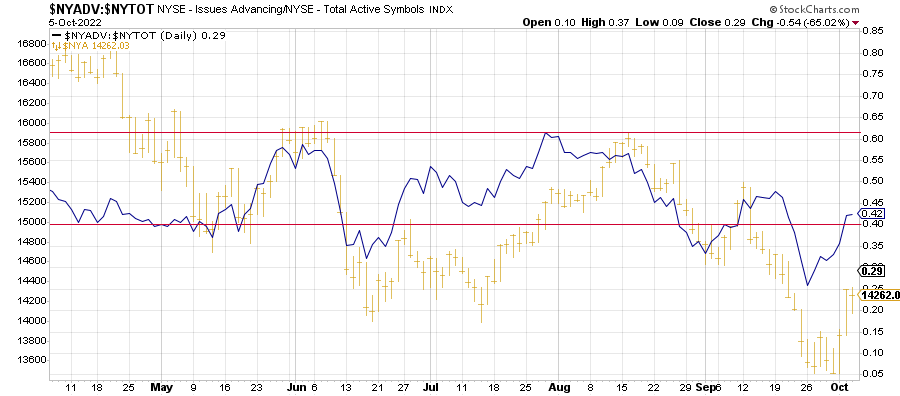
Second chart is using a 10 day SMA...now on day 3.
Neither one is likely to give a buy signal by day 10.
Fib
Better to ignore me than abhor me.
“Wise men don't need advice. Fools won't take it” - Benjamin Franklin
"Beware of false knowledge; it is more dangerous than ignorance" - George Bernard Shaw
Demagogue: A leader who makes use of popular prejudices, false claims and promises in order to gain power.
Technical Watch Subscriptions
#4
Chilidawgz
-

- Traders-Talk User
- 5,626 posts
A fool and his money... (the second mousie gets the cheese)
Posted 06 October 2022 - 11:42 AM
Ack! cannot post, sry
Edited by Chilidawgz, 06 October 2022 - 11:44 AM.
Anything can happen...what's happening now?
No one can forecast the future. No one.
All stocks (ETF's) are BAD...unless they go up - William O'Neil
When The Time Comes To Buy or Sell, You Won't Want To - Walter Deemer
#5
dTraderB
-

- Traders-Talk User
- 17,748 posts
Member
Posted 06 October 2022 - 12:23 PM
Many are talking about the recent "THRUST" possibilities:
What can we expect from the recent double thrusts in the market? Historically, they have always preceded positive returns,
writes in #SentimentEdge
This from a mail from Sentiment Trader:
What the research tells us- On consecutive sessions, more than 5 times as many securities on the NYSE advanced as declined.
- Even more notably, more than 10 times as much volume flowed into advancing than declining securities.
- Both types of thrusts have always preceded a positive one-year return in the S&P 500.
- Short-term returns tended to be weak as buyers took a temporary breath.
#6
dTraderB
-
- Traders-Talk User
- 17,748 posts
Member
Posted 06 October 2022 - 12:31 PM
Investors just can't get enough risk
Continuing the frenetic market that is 2022, buyers once again couldn't get enough risk assets to start this week.
Very similar to the action in March 2020, Monday and Tuesday witnessed overwhelming buying interest. On the NYSE, five times more securities advanced than declined, and ten times more volume flowed into advancing than declining securities.
It's rare to see so many stocks, preferred securities, and fixed income rising at the same time. Even going back to 1928, this hasn't happened too many times. We have less confidence in breadth metrics before 1950, so we'll limit the lookback to then.
When five times as many securities rose as declined on consecutive sessions, the S&P 500 never suffered a negative one-year return. Even over the next six months, there was only a single small loss.
The maximum decline even up to a year later was minuscule on average, though five of them suffered drawdowns larger than -5%. Every signal saw a maximum gain of more than +15% within the following year.
And when more than ten times as much volume flowed into advancing versus declining securities, returns were even more consistently positive. The sample size was smaller, but the results were more consistent.
Breadth thrusts have failed this year, depending on how they're defined, and what time frame we use. But before this week, we hadn't seen a thrust as powerful, as widespread, or coming from such low levels. What the research tells us
- On consecutive sessions, more than 5 times as many securities on the NYSE advanced as declined.
- Even more notably, more than 10 times as much volume flowed into advancing than declining securities.
- Both types of thrusts have always preceded a positive one-year return in the S&P 500.
- Short-term returns tended to be weak as buyers took a temporary breath.
#8
pdx5
-

- Traders-Talk User
- 9,529 posts
I want return OF my money more than return ON my money
Posted 07 October 2022 - 08:03 PM
The only fly in ointment is all those results probably were not during 8%+ inflationary periods. Since 1960, I have lived through only one long inflationary period..1974-1981. Depending on how long current inflationary period stretches out, that filter should not be ignored. By the way stocks did not do particularly bullish from 1974-1981.
Edited by pdx5, 07 October 2022 - 08:04 PM.
"Money cannot consistently be made trading every day or every week during the year." ~ Jesse Livermore Trading Rule


