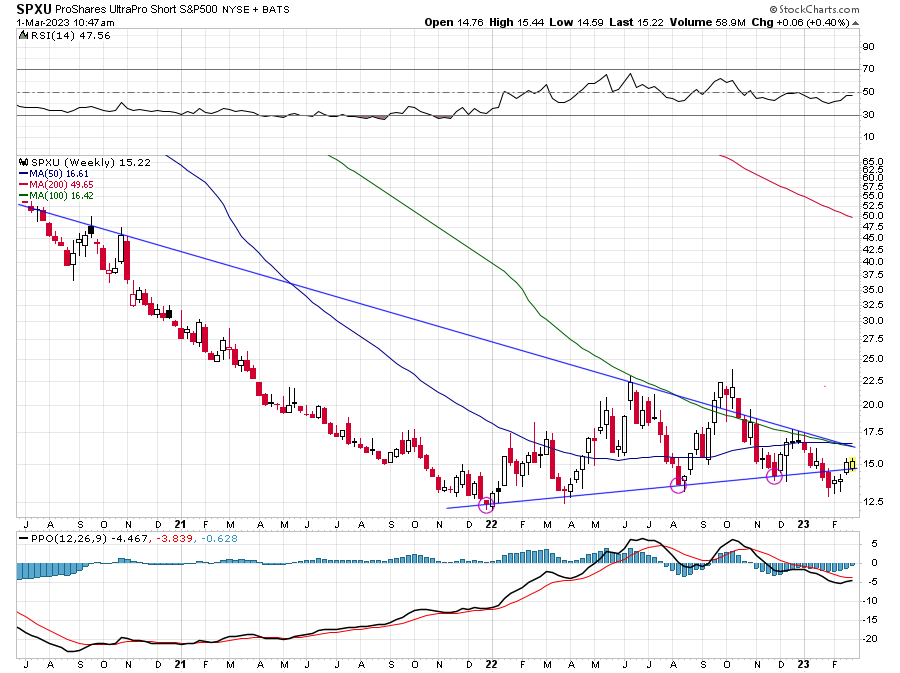
The market remains within the bear wedge from Jan. '22.
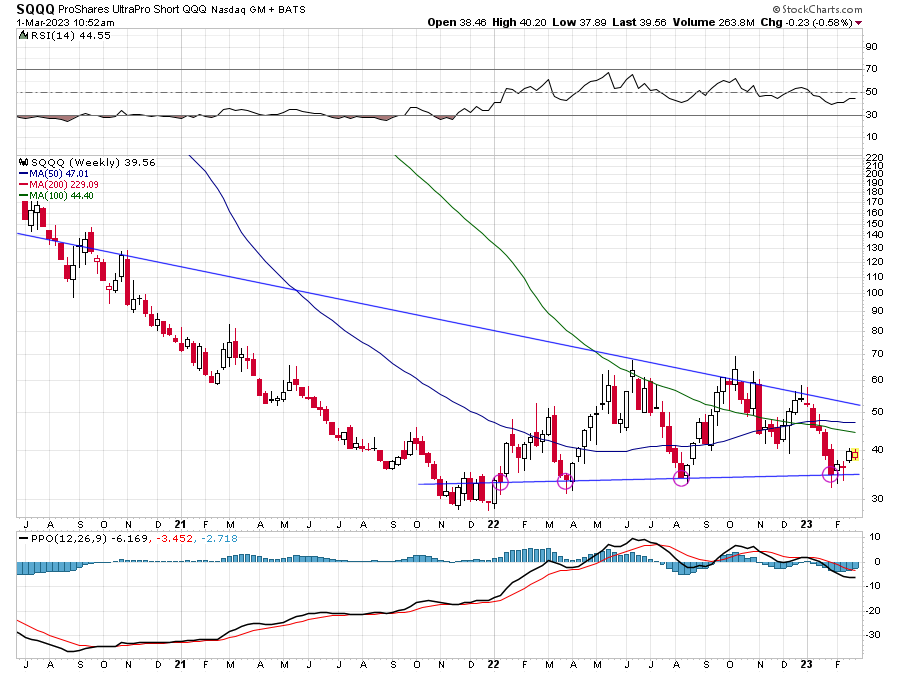
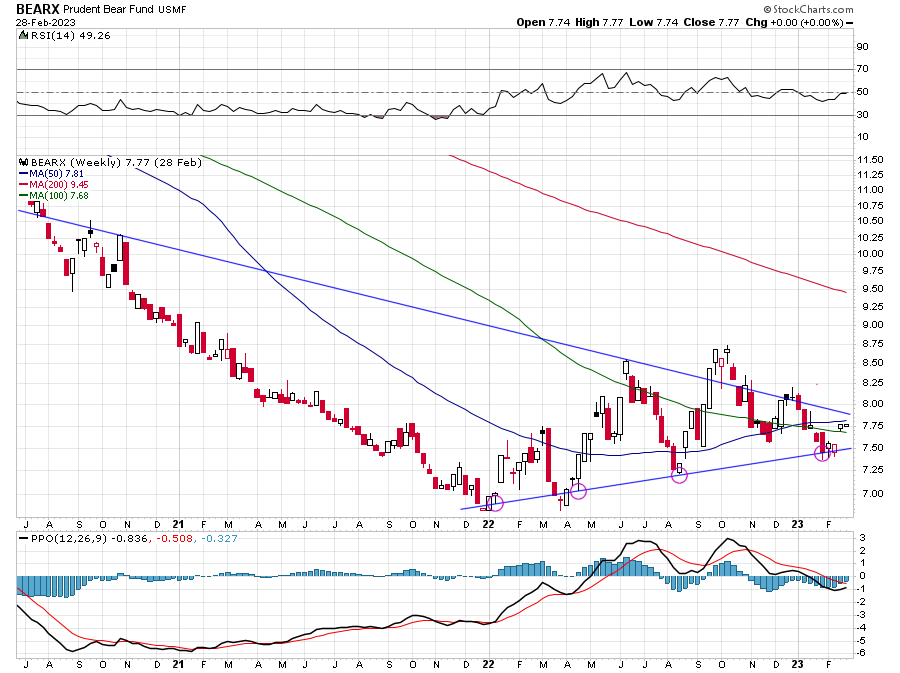
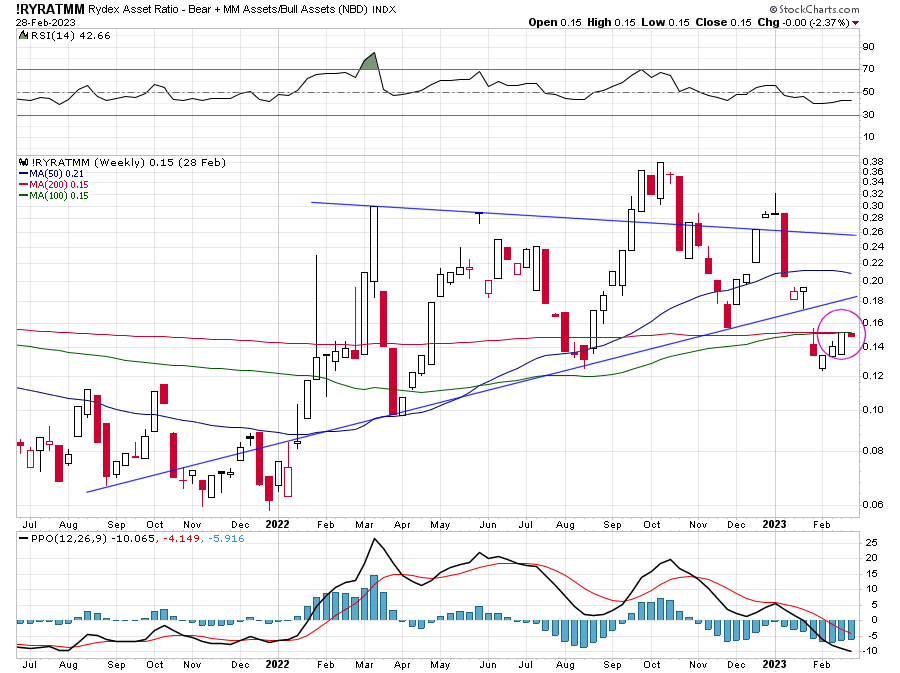
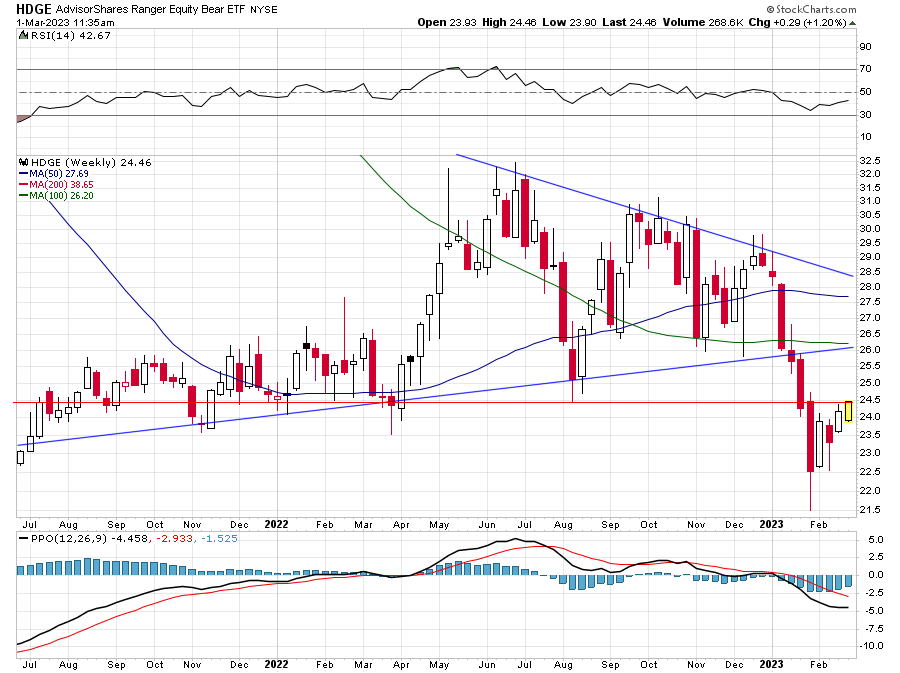
A significant shift in investor positioning to a more bullish stance took place in Jan. '23. Prices turned down in Feb. and some of the investors who were early to the rally started selling about 3 weeks ago, locking in some profit. Investors who were late to the rally now find themselves underwater, and they are hesitant to sell for a loss. This hesitance is represented on the ryratmm chart as butting-up against the 100 and 200 week averages - and on the hdge chart as a resistance level. If those resistances don't hold, one might anticipate accelerated selling as investors start cutting their losses. Although bears might be inspired by bullish investor sentiment and fearlessness, they are fed by bullish investor positioning, such is what took place in early '23. Imagine if those wedges were to break out to the upside instead of the down.