AAII is showing 23.4% Bullish and 44.8% Bears. This is a considerably more Bearish and a little more Bullish in a sloppy market. This is ST Bullish and, if we are trading like a bull, IT Bullish. Last week they were 21.6% Bullish and 38.6% Bearish.
I have no evidence to imply that this market is not trading like a Bull.

AAII
Started by
OEXCHAOS
, Mar 02 2023 03:58 PM
15 replies to this topic
#1

OEXCHAOS
-
- Admin
- 22,428 posts
Mark S. Young
Posted 02 March 2023 - 03:58 PM
Mark S Young
Wall Street Sentiment
Get a free trial here:
https://book.stripe....1aut29V5edgrS03
You can now follow me on X
#2
redfoliage2
-

- Traders-Talk User
- 19,261 posts
Member
Posted 02 March 2023 - 06:04 PM
US stock market made a 50 point intra-day reversal from morning's low albeit tons of negative news today: bad Euro CPI, strong US job data, 10 yr yield new high, Tesla downgraded.................. The recent correction to the bull run is likely done. BTW, CNN Fear and Greed index returned to Neutral.
Edited by redfoliage2, 02 March 2023 - 06:09 PM.
#3
steadyquest
-

- Traders-Talk User
- 943 posts
Member
Posted 03 March 2023 - 01:57 AM
"I have no evidence to imply that this market is not trading like a Bull."
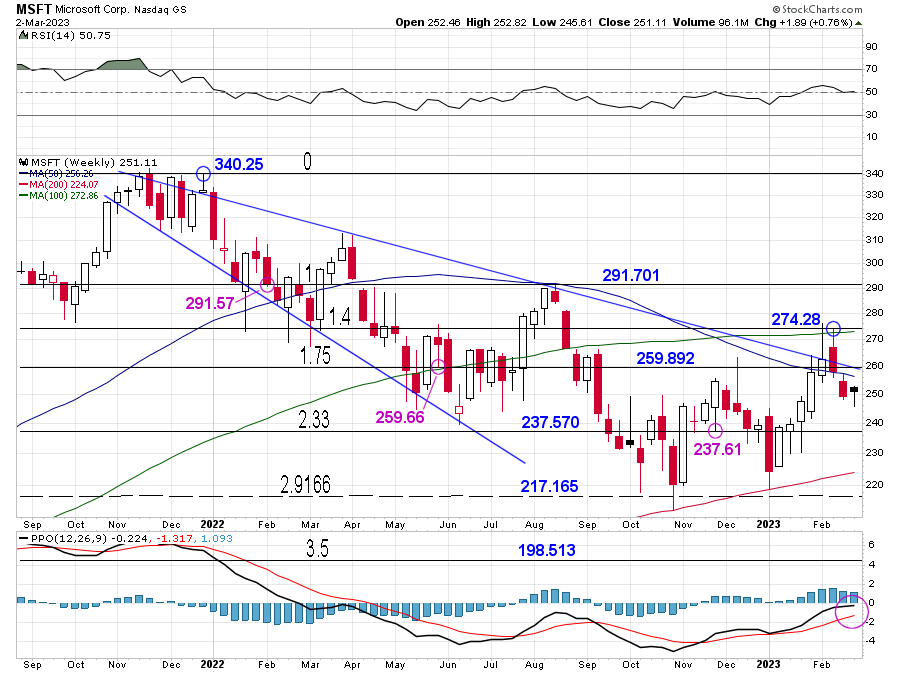
I don't know what to believe anymore - definitely not my own two eyes. Everything just seems nutty these days - on the weekly charts I can't find evidence that the market's not trading like a bear! Take aapl for instance. It looks like a failed breakout of a bullish megaphone, followed by a double backtest, then an effortless plunge through the 50 and 100 week averages, with a backtest of those that looks good so far - knock on wood. And the PPO is still below zero, i.e., don't go long unless you're a gambler - it also looks to be about to roll over.
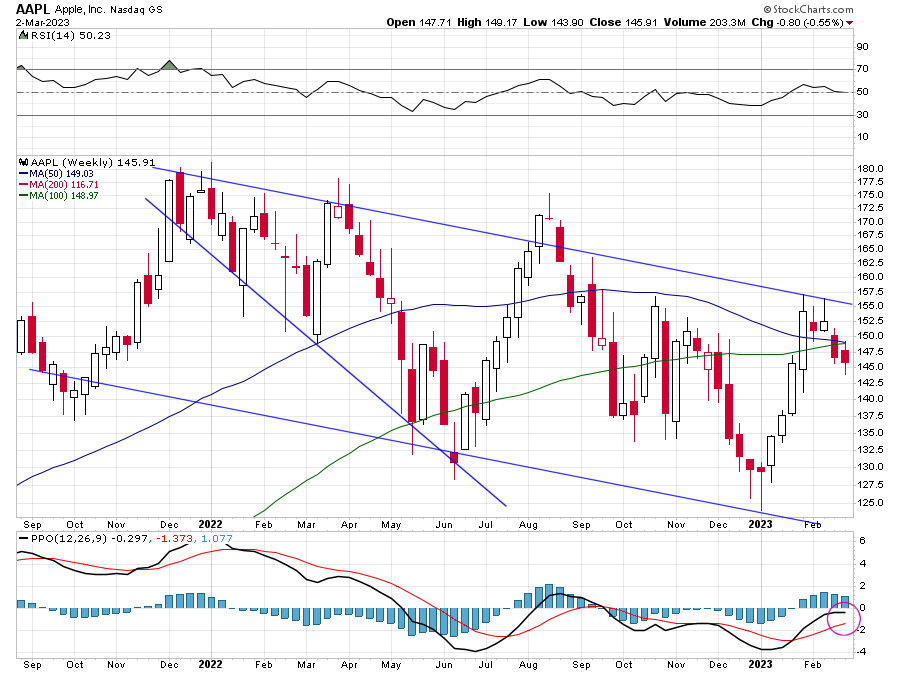
Msft appears to be in about the same shape.
I suspect the market will show its hand in the not too distant future - though it will likely start off with a fakeout move.
#4
OEXCHAOS
-
- Admin
- 22,428 posts
Mark S. Young
Posted 03 March 2023 - 12:05 PM
"I have no evidence to imply that this market is not trading like a Bull."
I don't know what to believe anymore - definitely not my own two eyes. Everything just seems nutty these days - on the weekly charts I can't find evidence that the market's not trading like a bear! Take aapl for instance. It looks like a failed breakout of a bullish megaphone, followed by a double backtest, then an effortless plunge through the 50 and 100 week averages, with a backtest of those that looks good so far - knock on wood. And the PPO is still below zero, i.e., don't go long unless you're a gambler - it also looks to be about to roll over.
Msft appears to be in about the same shape.
I suspect the market will show its hand in the not too distant future - though it will likely start off with a fakeout move.
For what it's worth, and I've not quantified this, but as I recollect, failed chart patterns on liquid stocks (and markets) is typical in a Bull market, but classic chart work seems to work well in a Bear.
In a Bear, formerly good indicators and signals tend to fail (both buys and sells), but it a Bull, they work more reliably.
M
Mark S Young
Wall Street Sentiment
Get a free trial here:
https://book.stripe....1aut29V5edgrS03
You can now follow me on X
#5
pdx5
-

- Traders-Talk User
- 9,641 posts
I want return OF my money more than return ON my money
Posted 03 March 2023 - 12:05 PM
Liquidating last 22% longs today at closing price.
I hate ST cap gains but enough is enough. Don't want to get greedy. Planning to buy 1 year notes after FED publishes rate change this month.
I hate ST cap gains but enough is enough. Don't want to get greedy. Planning to buy 1 year notes after FED publishes rate change this month.
"Money cannot consistently be made trading every day or every week during the year." ~ Jesse Livermore Trading Rule
#6
steadyquest
-
- Traders-Talk User
- 943 posts
Member
Posted 03 March 2023 - 01:44 PM
"...classic chart work seems to work well in a Bear."
Seems sort of catch-22ish - if charting works well in a bear but not in a bull, then a failed bullish breakout within a bear market should be regarded as a real and meaningful event, whereas it maybe should be ignored within a bull market. So are we in a bear or a bull?
https://www.youtube....h?v=o8gwtFMutyU
"...so I guess on your own advice I shouldn't take your advice."
"I wouldn't."
#7
qqqqtrdr
-

- Traders-Talk User
- 3,246 posts
Member
Posted 03 March 2023 - 04:46 PM
I look at a variety of issues in the market. From my experience the market is ready to break out and be bullish and catch a lot of people on the wrong side over the next couple of weeks. Reasons for this are bearishness. 10-day put call ratio starting to become a buy. McClellan Summation for $SPX is showing higher highs and higher lowers. With that said Rydex Ratio is not participating, so I think it will be a grind higher vs a large run.
#8
OEXCHAOS
-
- Admin
- 22,428 posts
Mark S. Young
Posted 03 March 2023 - 05:07 PM
"...classic chart work seems to work well in a Bear."
Seems sort of catch-22ish - if charting works well in a bear but not in a bull, then a failed bullish breakout within a bear market should be regarded as a real and meaningful event, whereas it maybe should be ignored within a bull market. So are we in a bear or a bull?
https://www.youtube....h?v=o8gwtFMutyU
"...so I guess on your own advice I shouldn't take your advice."
"I wouldn't."
Look at the overall trading, not just one. It's a weight of the evidence kind of thing.
There's definitely an experiential element. I'm just trying to give you an approach to move a little bit faster after a meaningful turn.
Mark S Young
Wall Street Sentiment
Get a free trial here:
https://book.stripe....1aut29V5edgrS03
You can now follow me on X
#9
SteveB
-

- Traders-Talk User
- 90 posts
Member
Posted 03 March 2023 - 07:48 PM
Steadyquest I feel for you. Down is up. Left is right. Wrong is right. Bearish is bullish. Bullish is.bullish. But there are 2 very reliable indicators I have discovered here on TT. In bear markets the watch the sky posts strongly correlate with market tops. And equally useful, in bull or bear markets, when Uranus predicts any market move the market moves exactly the opposite of the prediction.
Edited by SteveB, 03 March 2023 - 07:57 PM.
#10
skott
-

- Traders-Talk User
- 4,712 posts
Member
Posted 05 March 2023 - 02:13 AM
Steadyquest I feel for you. Down is up. Left is right. Wrong is right. Bearish is bullish. Bullish is.bullish. But there are 2 very reliable indicators I have discovered here on TT. In bear markets the watch the sky posts strongly correlate with market tops. And equally useful, in bull or bear markets, when Uranus predicts any market move the market moves exactly the opposite of the prediction.
I get it SteveB. Bookends. Uranus has been quiet lately


