 This is Jeff Huge from Alpha Insights.
https://www.jwhinvestment.com/about
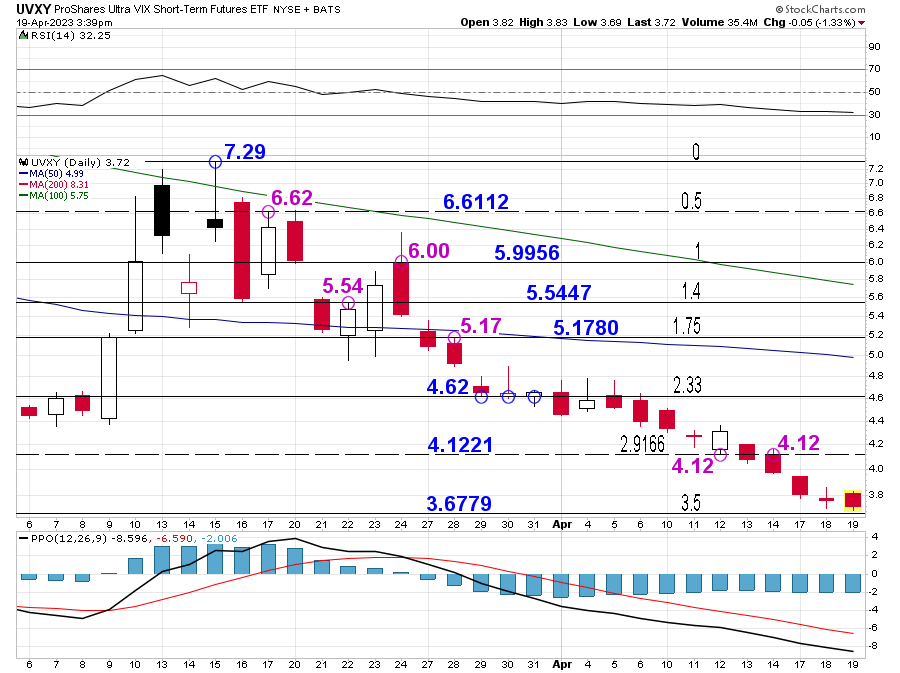
Very nice setup. I don't like when wave II retraces almost all of wave I, but given the completely bogus bullish market play, it makes sense.

Member
Posted 19 April 2023 - 01:52 PM
This is Jeff Huge from Alpha Insights.
https://www.jwhinvestment.com/about
Very nice setup. I don't like when wave II retraces almost all of wave I, but given the completely bogus bullish market play, it makes sense.
Member

Member

Posted 20 April 2023 - 09:31 AM
This market has been ignoring the likelihood the coming economic recession, and maybe it's time for it to wake up:
https://www.investin...uring-index-236
Member

Posted 20 April 2023 - 12:02 PM
https://www.jwhinvestment.com/about
Very nice setup. I don't like when wave II retraces almost all of wave I, but given the completely bogus bullish market play, it makes sense.
It also has the same signature as the Sign Of the Bear pattern that was prominent back in 1st quarter of 2022.
More on this structure can be found at: https://tinyurl.com/2xl2m7wu
Fib
Better to ignore me than abhor me.
“Wise men don't need advice. Fools won't take it” - Benjamin Franklin
"Beware of false knowledge; it is more dangerous than ignorance" - George Bernard Shaw
Demagogue: A leader who makes use of popular prejudices, false claims and promises in order to gain power.
Member

Posted 21 April 2023 - 06:44 AM
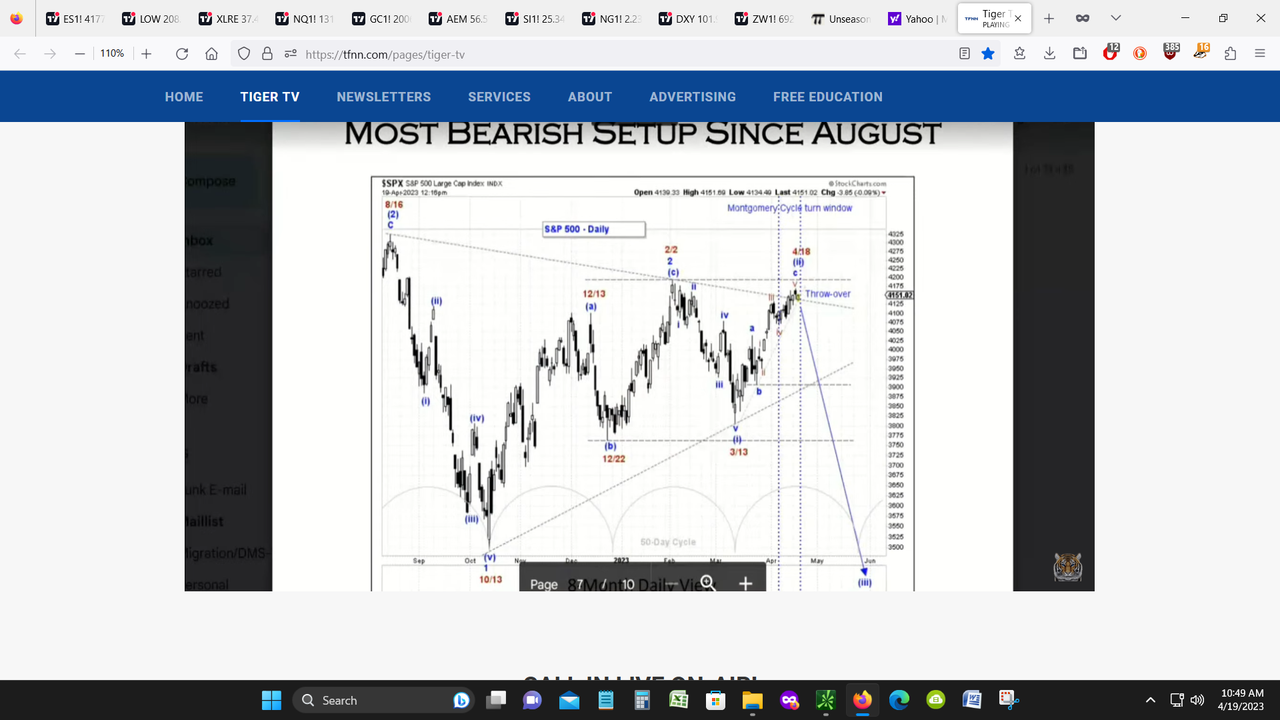
Rally from October 13 through December 13 was 42 days and 608 points. The rally from March 13 through April 18 was 26 days was 362 points.
https://www.jwhinvestment.com/about
Very nice setup. I don't like when wave II retraces almost all of wave I, but given the completely bogus bullish market play, it makes sense.
Edited by Waver, 21 April 2023 - 06:45 AM.
Member
Posted 21 April 2023 - 11:21 AM
Or keep fingers crossed and eyes to the heavens?
Member
Posted 21 April 2023 - 01:02 PM
An endgame now......................
Edited by redfoliage2, 21 April 2023 - 01:07 PM.