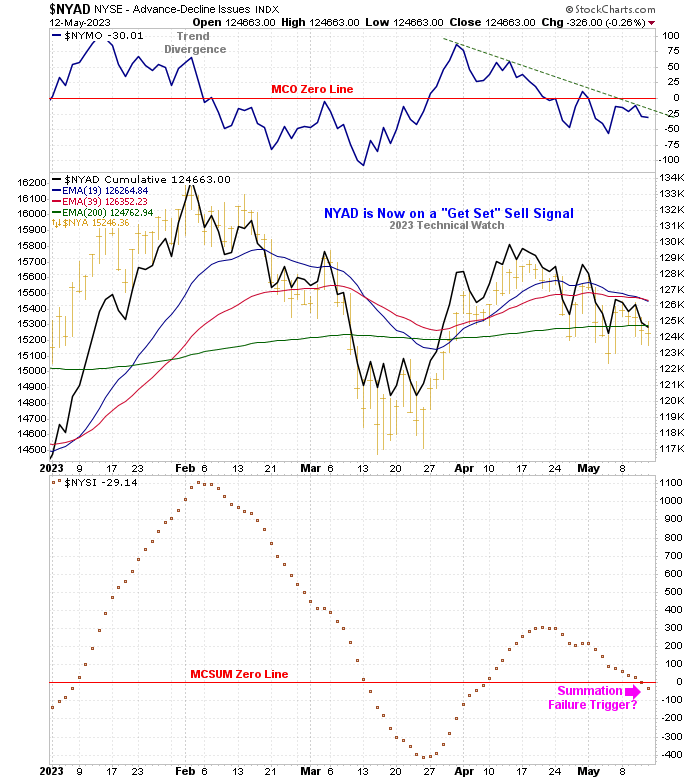
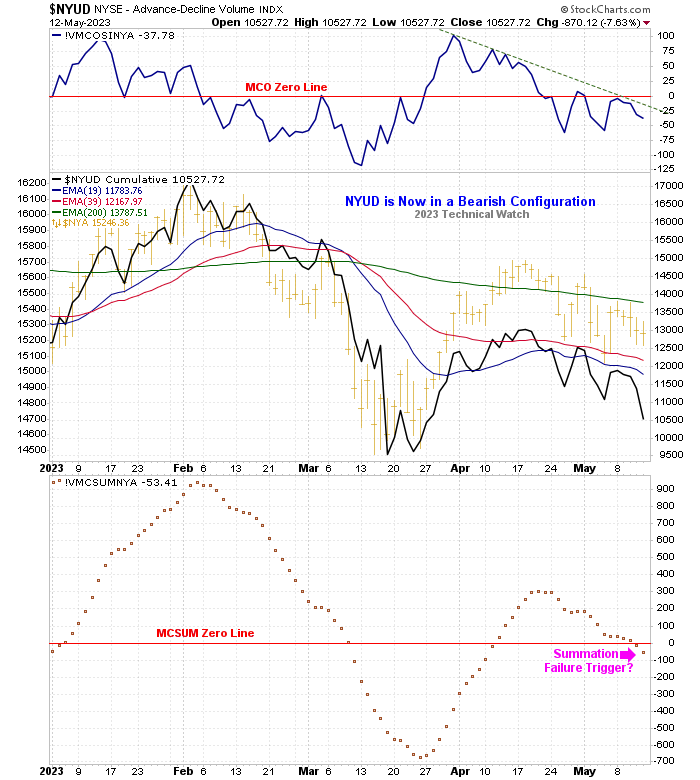
Updated charts of the NYAD and NYUD are shown below displaying the current (McClellan) "Summation Failure" triggers at work here.
For those who may be wondering, the overall classic sequence of such events is to see the MCSUM move up and through the +500 level; correct the "overbought" readings to or toward the zero line; attempt to re-initiate the previous bullish breadth thrusts by moving back above the +500 level (and break free of the bear market default); failing to do so below the +500 level (or even weaker at the +250 level); with the "trigger" taking place once the MCSUM moves down and through the zero line as traders recognize that the price trend has switched from up to down and rush for the exits. Sometimes the exit is a revolving door where only a few can get through, while the rest panic at any price which causes the "crash like" event. Other times is just a wide open door that one can just walk through minus the urgency to do so. The key on both the likelihood and intensity of such triggers is the dynamics of the raw cumulative data that are being measured. Right now, NYSE cumulative volume is leading breadth to the downside where volume is the directional rudder for price, while breadth is in a weakening holding pattern waiting for more information. The charts below also show what the MCSUM measures: the distance between the 19 day EMA and the 39 day EMA where the zero line is where these two EMA's cross (yes, the NYUD chart array is "off", but try as they might, StockCharts can't seem to correct this very important discrepancy).
With all this as a background then, the current event has been muted so far with European issues telling a completely different story as their A/D lines hover around their all time highs. So if we're going to get such an event, it should take place by Tuesday or it will go off the board and we'll continue to drip, drip, drip away with the path of least resistance to the downside. The other insight we have here is that instead of finding support at the zero line back in March, both the NYAD and NYUD Summation Indexes overshot these levels which highly suggests that the overall market structure has been huffing and puffing its way higher since the October 13th lows (due mainly to the ever evaporating liquidity pool as a result of a hawkish monetary policy). So if the MCSUM's can turn higher from here (at around the zero line), and form a bottom above a bottom, then the summer months should see a bullish bias into early August. If not, then the October 13th lows will be taken out (maybe by the end of May) with new downside price projections given for the major market indices for the 3rd quarter.
For now...watch the small caps and NASDAQ as they are the most sensitive to the rise and fall of the liquidity pool as it sloshes back and forth,
For those interested, the following link will take you this week's Cumulative Charts for your added review: http://www.technical...3/cum051223.htm
Have a great week of trading!
Fib