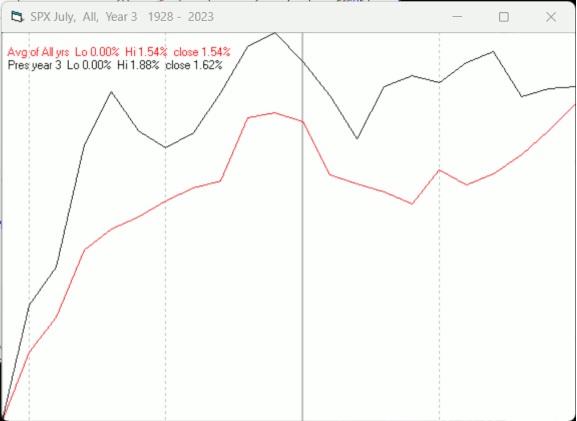
I looked at Landrey's T to the MC Osc and got July 28 for the next low
That's close enough for me.
There are various interpretations and "rules" in T Theory.
Your Guess is as good as mine.
The host of the T Theory website seemed to question a bit the validity of the Early August date.
It would be the first one like this (this long) that I have ever seen.
Another member here pointed it out to me many weeks ago.
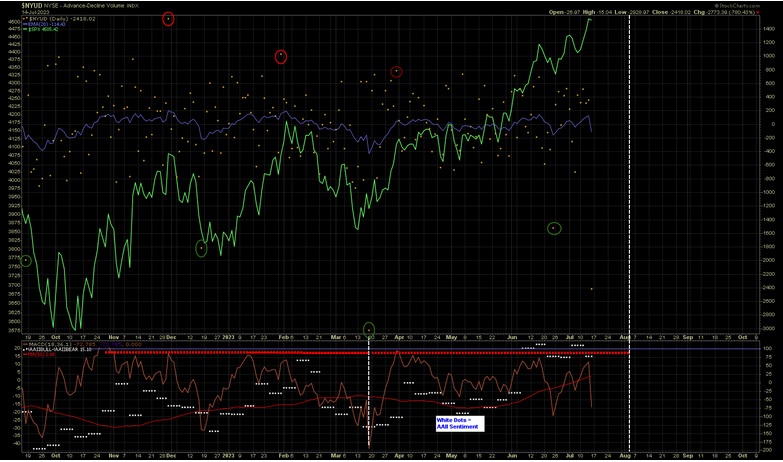
My simple "Horseshoes and hand grenades" method looks for extreme highs in the MACD of the NYUD to be followed by an extreme low.
That time frame is then mirrored to possibly locate the end date of that T.
NOTE:(The last extreme low NYUD dot from Friday is not the final from Friday,)
T-Theory Thoughts – A place for the old and slow to reach investment decisions, dedicated to the teachings of Terry Laundry
The 2023 T Theory Main Chart has become messy. I may remove some of the notes. Right now, I can’t confirm that we are in a T based on my methods, although some students of T-Theory may have a different opinion. Is it still possible that we are in a longer T which will last until the beginning of August? Possibly:
Edited by Rogerdodger, 16 July 2023 - 10:25 AM.