Jump to content


Photo

Fear/Greed and Seasonal Strength


  • Please log in to reply
3 replies to this topic

#1 Rogerdodger

Rogerdodger

    Member

  • TT Member*
  • 26,874 posts

Posted 01 October 2023 - 12:31 AM

Sept 22nd: I said the bear likely had more to go, but another drop in the SPX would be an interesting buy spot.

SPX dropped another 50 points after that, but it looks like the bear's time is up...for a little while at least.

Seasonality is positive (more so for SPX) Mid-month not so much for other indices.

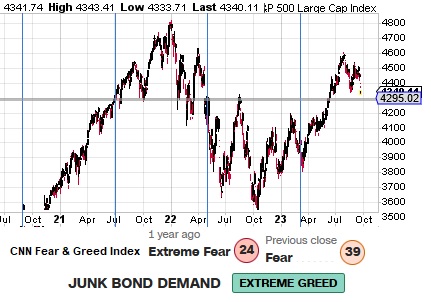
CNN Sentiment was low Friday at 28, down from 39 a week ago.

Shutdown circus is over for 40+ days anyway.


Mike Burk's Seasonality:

The good news is:

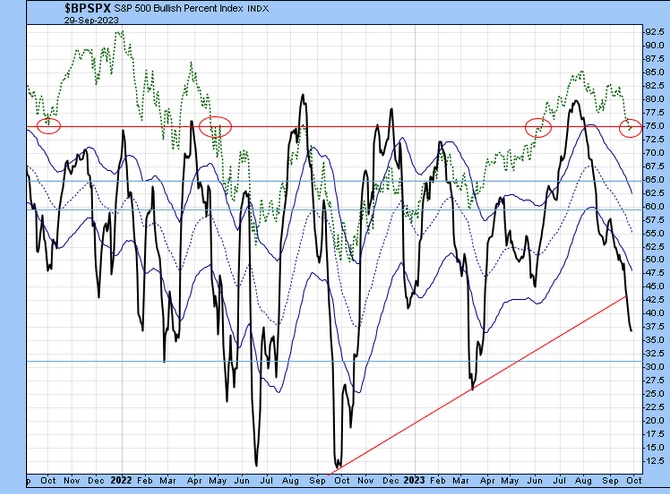
  • New lows declined by more than half from Thursday to Friday.
  • The market is oversold and Seasonality improves after this week

  • During the 3rd year of the Presidential Cycle October has been up 60% time (See charts)


Posted 22 September 2023 - 09:24 AM

CNNs Fear and Greed index is low, but another drop in the SPX would be an interesting buy spot.

TLT or Corp bonds (VCIT?) might become interesting As JUNK is getting "overdone."


Fear-Greed.jpg


.

.


Edited by Rogerdodger, 01 October 2023 - 12:39 AM.


#2 Rogerdodger

Rogerdodger

    Member

  • TT Member*
  • 26,874 posts

Posted 01 October 2023 - 12:39 PM

BP-10-1.jpg


#3 Rogerdodger

Rogerdodger

    Member

  • TT Member*
  • 26,874 posts

Posted 01 October 2023 - 12:58 PM

T Theory site is not available right now, so here's my chart.

Doesn't look real positive. I think we need a lower low on the MACD to form any center post.

So maybe we get a s/t bump up before a better low?


T-Theory-10-1.jpg


Edited by Rogerdodger, 01 October 2023 - 01:02 PM.


#4 Rogerdodger

Rogerdodger

    Member

  • TT Member*
  • 26,874 posts

Posted 03 October 2023 - 09:32 AM

Fear and Greed (at 19) just dropped below last years' early October low at (20)

Junk Bonds moved from Extreme Greed to Neutral today.


Is that a tell of a quick bear burn?

It did that a year ago in a quick spike up in price, then SPX reversed to a final lower low.


See: https://www.cnn.com/.../fear-and-greed

Note: The frequent drops of the yield spread on the Junk Bond Demand chart usually appear on the ex-dividend date. The spread typically bounces back after the dividend is paid and normalizes over time.

Edited by Rogerdodger, 03 October 2023 - 09:35 AM.