NYSE Up Volume -2824.07 and trending down. Fewer buyers up here at these levels. Will the
last Bull who leaves the building please turn the lights off.

Member
Posted 26 December 2023 - 04:41 PM
NYSE Up Volume -2824.07 and trending down. Fewer buyers up here at these levels. Will the
last Bull who leaves the building please turn the lights off.
Member

Posted 26 December 2023 - 09:35 PM
You have to allow volume data to settle...sometimes up to 4 hours after the close.
And sometimes, the next day.
Here's today's data from Barron's...everything looks fine and dandy:
Fib
Total
2,581,556,900 Advancing 2,011,934,498 Declining 535,166,953 Unchanged 34,455,449
Better to ignore me than abhor me.
“Wise men don't need advice. Fools won't take it” - Benjamin Franklin
"Beware of false knowledge; it is more dangerous than ignorance" - George Bernard Shaw
Demagogue: A leader who makes use of popular prejudices, false claims and promises in order to gain power.
Technical Watch Subscriptions
Member
Posted 26 December 2023 - 10:04 PM
You're looking at the data for one day, but I look at the change in the data. Today the
NYSE Up Volume was 1.35% lower than Friday and has been trending down for the
past 7 trading days which indicates that fewer people are buying up here at these levels.
I want return OF my money more than return ON my money

Posted 26 December 2023 - 10:15 PM
Higher prices for goods and services have resulted in less inflation. Because demand has slacked off.
Higher prices for stocks should be a hindrance to bulls. But Bulls are incorrigible. They will push stocks higher than justified.
Edited by pdx5, 26 December 2023 - 10:16 PM.
Member
Posted 27 December 2023 - 06:05 AM
You're looking at the data for one day, but I look at the change in the data. Today the
NYSE Up Volume was 1.35% lower than Friday and has been trending down for the
past 7 trading days which indicates that fewer people are buying up here at these levels.
You’re dealing with, what is traditionally, the slowest trading week(s) of year (due to the holidays) with daily volume likely to contract even more as we finish out the year. That said, the short term trend of volume, as measured by the McClellan Oscillator, has been firm to strong over the last week (the Dow being the weakest link). To wit, when measuring volume (and breadth) it’s always a simple case of quality over quantity when it comes to supply and demand market dynamics and price trend momentum. Right now, prices should continue to trend higher into January OPEX.
Fib
Better to ignore me than abhor me.
“Wise men don't need advice. Fools won't take it” - Benjamin Franklin
"Beware of false knowledge; it is more dangerous than ignorance" - George Bernard Shaw
Demagogue: A leader who makes use of popular prejudices, false claims and promises in order to gain power.
Technical Watch Subscriptions
Member

Posted 27 December 2023 - 07:34 AM
books are closeed until next week.
Member
Posted 30 December 2023 - 10:34 AM
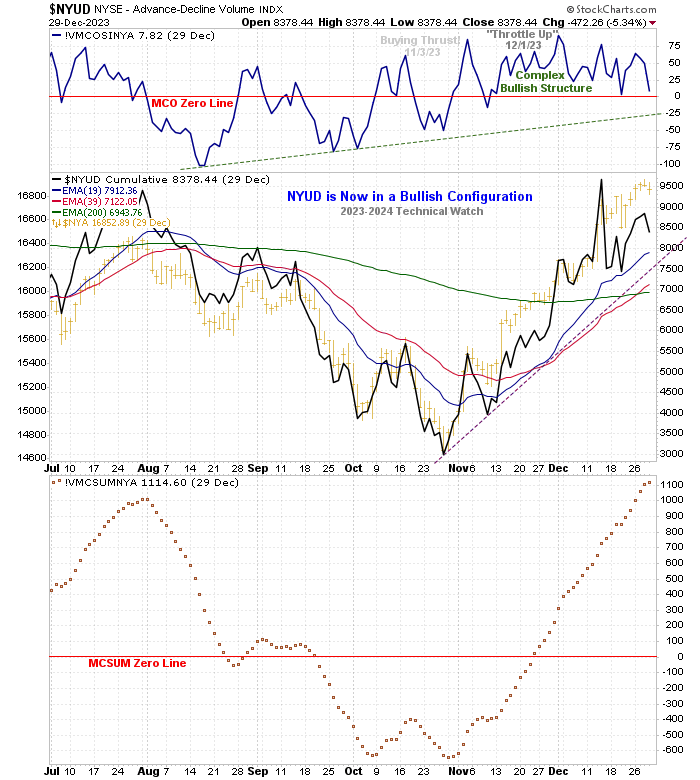
Fib, the McSumm is an EMA of net davances without regard to volume. Consequently, the
McSumm merely looks at the number of net advances without calculating the volume
pertaining to those net advances. As you know, last week the McSumm continued its
strong advance, but last week the NYSE Up Volume declined and the NYSE Down
Volume increased. So, last week while net advances increased fewer people bought
those advances while more people sold into the strength. That is not a good thing if
your bullish and is one of the reasons why I think we'll see a pullback in Jan. The
charts showing the volume data that I follow can be seen at StockCharts with the
symbols !uvolnya and !dvolnya.
Member
Posted 31 December 2023 - 05:07 AM
Fib, the McSumm is an EMA of net davances without regard to volume. Consequently, the
McSumm merely looks at the number of net advances without calculating the volume
pertaining to those net advances. As you know, last week the McSumm continued its
strong advance, but last week the NYSE Up Volume declined and the NYSE Down
Volume increased. So, last week while net advances increased fewer people bought
those advances while more people sold into the strength. That is not a good thing if
your bullish and is one of the reasons why I think we'll see a pullback in Jan. The
charts showing the volume data that I follow can be seen at StockCharts with the
symbols !uvolnya and !dvolnya.
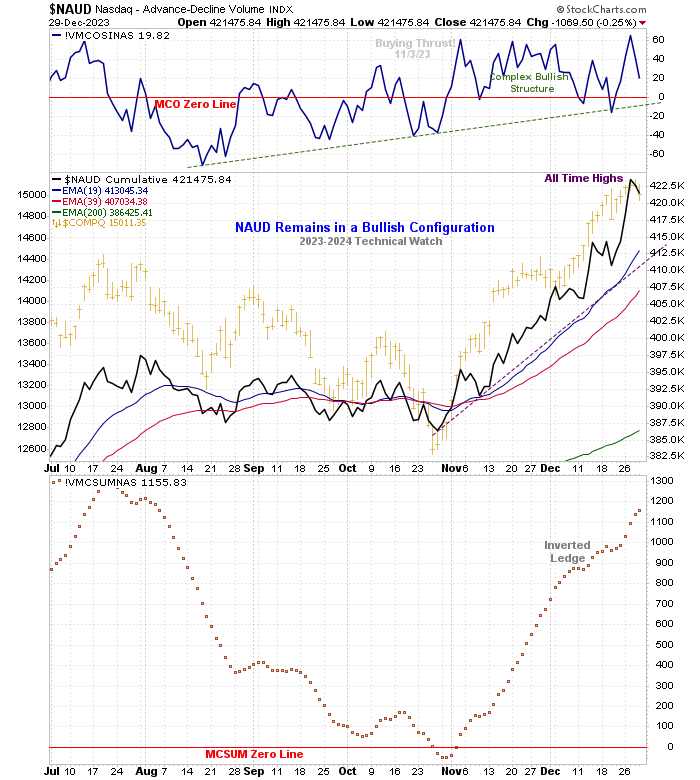
Volume data through Friday…though we’ll likely see the raw cumulative data adjusted Tuesday morning (NASDAQ volume data is shown below):
Edited by fib_1618, 31 December 2023 - 05:34 AM.
Better to ignore me than abhor me.
“Wise men don't need advice. Fools won't take it” - Benjamin Franklin
"Beware of false knowledge; it is more dangerous than ignorance" - George Bernard Shaw
Demagogue: A leader who makes use of popular prejudices, false claims and promises in order to gain power.
Technical Watch Subscriptions
Member
Posted 31 December 2023 - 10:34 AM
Your $NYUD chart confirms my point. Last week the NYUD put in a rather meaningful
negative divergence. If you overlay the SPX chart on the NYUD chart this negative
divergence is clearly shown.
Member
Posted 31 December 2023 - 11:53 AM
Your $NYUD chart confirms my point. Last week the NYUD put in a rather meaningful
negative divergence. If you overlay the SPX chart on the NYUD chart this negative
divergence is clearly shown.
There is a marked difference between the potential for bearish (or bullish) divergence as opposed to a lessening of buying (or selling) pressure based solely on the context of the trend being measured. The short term trend, as represented by the MCO, is that of 4-6 weeks, while the intermediate term MCSUM is 6-12 weeks in duration. Your daily comparable observation has been noted, although according to the data provided, it's currently not as important as it will be when the McClellan Summation Index moves down and through the +500 level.sometime after the middle part of January. Until then, prices will continue to be "buoyant" as the buyers maintain their intermediate term control of imbalance.
Also, as mentioned before, keep in mind that the cumulative NYUD chart will likely be adjusted Tuesday morning. Once that's done, I will update the chart as to the final settlement with the divergence shown on the NYUD not likely to change analytically enough to really matter within the subject of this thread. Another thing to consider is that the spike you see on December 14th was due to one of the heaviest volume quarterly OPEX events in history, so anything after that is likely to "diverge" as we move forward as buying pressure (the amount of investment capital that can be put to work) continues to lessen.
Thanks for the discussion.
Fib
Better to ignore me than abhor me.
“Wise men don't need advice. Fools won't take it” - Benjamin Franklin
"Beware of false knowledge; it is more dangerous than ignorance" - George Bernard Shaw
Demagogue: A leader who makes use of popular prejudices, false claims and promises in order to gain power.
Technical Watch Subscriptions


