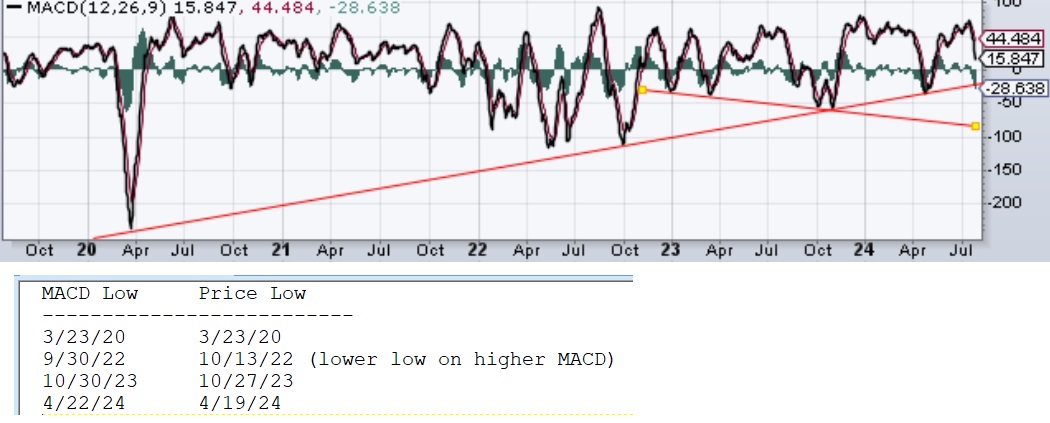
This major support line on the SPX MACD runs from the 3/23/20 low up to now, rising and capping down trends - if it should break to the downside I would expect fireworks. Note also I drew the smaller down trending support line, if the major trend line is broken I would be looking for contact with this line and what happens after. I listed in the chart both the MACD lows and corresponding price lows for the major support line.

SPX MACD larger trend since 2020
Started by
gm_general
, Jul 26 2024 12:20 PM
1 reply to this topic