
3 black crows
Started by
Chart Guru Doug
, Jan 22 2005 06:07 AM
65 replies to this topic
#61

securelstmile
-

- Banned
- 2,603 posts
Member
Posted 23 January 2005 - 12:42 PM
I also think aaple will not be the only computer maker to see a halo effect from ipod.
Many people are upgrading their computers because older computers are useless with an ipod.
I don't think it will be as dramatic a halo effect for this much larger company but it will surprise to the upside.
Also, msft had a very hot game called halo2 that came out and I am sure that the number of purchases of that game will exceed even the most optimistic expectations similar to ipod sales.
I know some say it is just a game but it topped $125 million in sales in one day.
Sooooooo we have the halo effect and the halo 2 effect all in the same quarter.
The harder I work, the luckier I get.
#62
IndexTrader
-

- TT Patron+
- 7,694 posts
Member
Posted 23 January 2005 - 01:57 PM
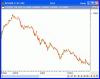
Yes IndexIt's difficult to see how you can have a serious conversation about candlesticks when referring to either the Dow Industrials or the SPX. Both indices open near the prior close due to the way the indices are calculated. Thus on days where a gap may take place (like two days ago), SPX and the Dow will distort the candle because it shows an unchanged opening. Same thing is true on 1/3/2005 where we gapped up, yet the Dow and SPX show an unchanged opening. AGain, distortion in the candle.
Thus when one looks at the history of candles, where recent price action isn't fresh in your memory, you have no idea whether one specific candle is correct or not...because you don't know whether there was a gap or not, which changed the type of candle and the potential pattern.
IndexTrader
they do not show the gaps but the do show tails and up or down closes. The crow pattern is very rare on the chart and has proven itself pretty effective as you can see by the examples, so it appears to be a very serious pattern.
I don't know how you could tell if it's a "serious pattern". For instance, Gann-Trader goes back in history to find examples of this pattern so that he can backtest it. Yet we already know that the indices like Dow and SPX distort candles, so what he is finding in history may or may not be the patterns in question...there's no way to know at this point because we have no clue how the market opened on that particular series of days in question.
You need to use indices that actually trade....for instance the SPY, instead of the SPX. Or maybe the Diamonds instead of the DOW.
I'm not saying that 3 crows doesn't work....I'm saying you can't know that since you're looking at candles that aren't necessarily accurate in the message that they convey.
IndexTrader
#63
Chart Guru Doug
-
- Traders-Talk User
- 2,789 posts
Member
Posted 23 January 2005 - 02:10 PM
ITYes IndexIt's difficult to see how you can have a serious conversation about candlesticks when referring to either the Dow Industrials or the SPX. Both indices open near the prior close due to the way the indices are calculated. Thus on days where a gap may take place (like two days ago), SPX and the Dow will distort the candle because it shows an unchanged opening. Same thing is true on 1/3/2005 where we gapped up, yet the Dow and SPX show an unchanged opening. AGain, distortion in the candle.
Thus when one looks at the history of candles, where recent price action isn't fresh in your memory, you have no idea whether one specific candle is correct or not...because you don't know whether there was a gap or not, which changed the type of candle and the potential pattern.
IndexTrader
they do not show the gaps but the do show tails and up or down closes. The crow pattern is very rare on the chart and has proven itself pretty effective as you can see by the examples, so it appears to be a very serious pattern.
I don't know how you could tell if it's a "serious pattern". For instance, Gann-Trader goes back in history to find examples of this pattern so that he can backtest it. Yet we already know that the indices like Dow and SPX distort candles, so what he is finding in history may or may not be the patterns in question...there's no way to know at this point because we have no clue how the market opened on that particular series of days in question.
You need to use indices that actually trade....for instance the SPY, instead of the SPX. Or maybe the Diamonds instead of the DOW.
I'm not saying that 3 crows doesn't work....I'm saying you can't know that since you're looking at candles that aren't necessarily accurate in the message that they convey.
IndexTrader
I am getting your point. Mine is this,
just look at the charts showing the patterns, then look at the results of the patterns, then look for where those patterns have failed. Look at both the dji and spx and go back as far as charts will allow and show me where that pattern has failed? The message of the charts is very clear, if we stay below the 3 candle high=we are at high risk of some more serious selling. Also by looking at those charts=a short term rally is nearly inevitable. That is the message that the charts send. jmho......
I am not your registered investment advisor. This is not a recomendation to buy or sell. This is my opinion and that is all. I may be long or short any security and change my position at any given moment in time. Do your own due diligence before investing any of your own financial assets.
#64
gorydog
-
- Traders-Talk User
- 738 posts
Member
#65
securelstmile
-
- Banned
- 2,603 posts
Member
Posted 24 January 2005 - 11:53 AM
Could also be a ladder bottom. We would need a big up day tomorrow for confirmation. Stay tuned.
http://www.litwick.c...ators/1124.html
http://www.litwick.c...ators/1124.html
The harder I work, the luckier I get.
#66
SemiBizz
-

- Traders-Talk User
- 23,208 posts
Volume Dynamics Specialist
Posted 24 January 2005 - 04:03 PM
Oh yeah, them 3 black crows is bearish alright.... I hope ya'll stayed nice and short, this ain't over yet.....
Edited by SemiBizz, 24 January 2005 - 04:04 PM.
Price and Volume Forensics Specialist
Richard Wyckoff - "Whenever you find hope or fear warping judgment, close out your position"
Volume is the only vote that matters... the ultimate sentiment poll.
http://twitter.com/VolumeDynamics http://parler.com/Volumedynamics
Richard Wyckoff - "Whenever you find hope or fear warping judgment, close out your position"
Volume is the only vote that matters... the ultimate sentiment poll.
http://twitter.com/VolumeDynamics http://parler.com/Volumedynamics


