Jump to content


Photo

New Indicator?


  • Please log in to reply
5 replies to this topic

#1 OEXCHAOS

OEXCHAOS

    Mark S. Young

  • Admin
  • 22,026 posts

Posted 08 March 2007 - 10:53 AM

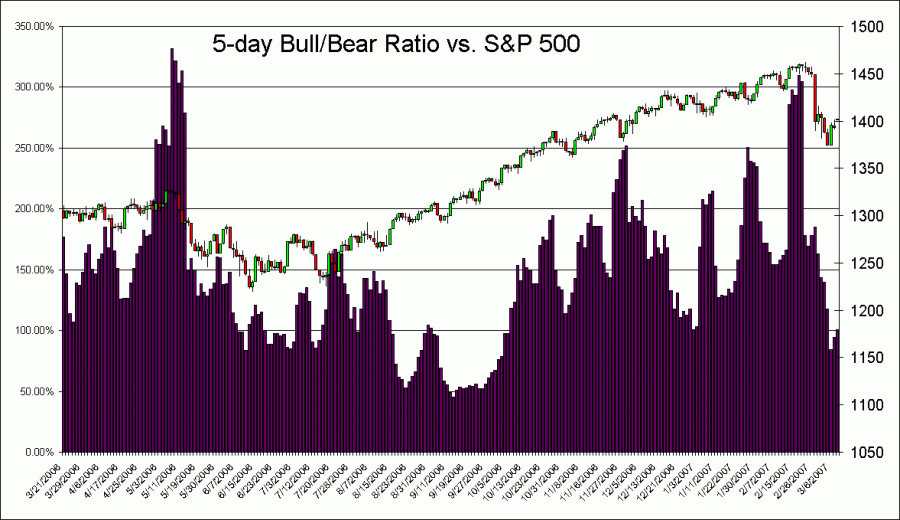
hey, guys. I'm working with the FF Sentiment data (thanks to randy and dcengr), and thought I'd show you this chart. I'm still tweaking, but check it out anyway. Fully_short_Study_03_08_07.gif

Mark S Young
Wall Street Sentiment
Get a free trial here:
http://wallstreetsen...t.com/trial.htm
You can now follow me on twitter


#2 da_cheif

da_cheif

    Member

  • Traders-Talk User
  • 10,963 posts

Posted 08 March 2007 - 10:56 AM

seems to be inconsistant.......

#3 OEXCHAOS

OEXCHAOS

    Mark S. Young

  • Admin
  • 22,026 posts

Posted 08 March 2007 - 11:10 AM

I'm, thinking that the moving average may not show the subtleties in the data very well. Also, the ratio may not be the best way to look at it. We CAN see, however, that at ratios north of 3, you had better look out below, at least briefly and at ratios below one, it's likely that we'll get a rally of some sort. This also shows us when folks are fighting a trend, too. As I said, I'm tweaking it. There's a lot of subtlety in the data. I know this because I look at it every day and try to make sense of it. I think we'll look at some other permutations of the same data. Mark

Mark S Young
Wall Street Sentiment
Get a free trial here:
http://wallstreetsen...t.com/trial.htm
You can now follow me on twitter


#4 mdwllc

mdwllc

    Member

  • Traders-Talk User
  • 574 posts

Posted 08 March 2007 - 11:17 AM

Since I've been following it, there has always been a divergence between the bulls/bears on belief versus conviction. The composite numbers of the Bulls usually indicate they are convinced enough to have a "partial" or fully invested position". The composite of the Bears always indicates there maybe a belief but no conviction to "place the bets...an example of what I mean there maybe a total of 30 with a bearish belief but only ~14 or so are "partially" or "fully" positioned short. Therefore, I intuitively suspect a incorporating a weighting with the positions might be more enlightening. MDW :)
Lead, Follow or Get Out of the Way...

Be Sure to Perform Your Own Due Diligence

#5 OEXCHAOS

OEXCHAOS

    Mark S. Young

  • Admin
  • 22,026 posts

Posted 08 March 2007 - 11:29 AM

this is Fully Long vs. Fully Short, then then averaged over 5 days. Sorry I wasn't clear. I'm thinking about also charting the raw data separately as well as playing with the moving average. Mark

Mark S Young
Wall Street Sentiment
Get a free trial here:
http://wallstreetsen...t.com/trial.htm
You can now follow me on twitter


#6 traderpaul

traderpaul

    Member

  • Traders-Talk User
  • 6,034 posts

Posted 08 March 2007 - 11:36 AM

this is Fully Long vs. Fully Short, then then averaged over 5 days. Sorry I wasn't clear. I'm thinking about also charting the raw data separately as well as playing with the moving average.

Mark

mark, How about a 5 days running (sum of last 5 days) total instead of a 5 days moving average? or use a short exponent moving average?

Edited by traderpaul, 08 March 2007 - 11:39 AM.

"Inflation is taking place now. Prices may not appear to be rising because they are making packaging smaller. "— Rickoshay