First let me state that I'm NOT predicting a crash. I just wanted to throw this out there because it is an anamoly.
I just read a piece on Market Tells by Rainsord Yang. He points out that the only other time in history we've seen three 90+% volume down days concentrated in a 3 week span was October of 1987.

FWIW....90% Down Vol Days
Started by
Cirrus
, Mar 14 2007 10:47 AM
12 replies to this topic
#2

arbman
-

- Traders-Talk User
- 19,504 posts
Quant
Posted 14 March 2007 - 11:13 AM
If the currency continues to slip down further and so far we did not see any strong bounce in response to this correction, it is a unique possibility. I actually think that the markets are closer to a crash now than they were at the top! 
I said this many times here and I repeat, the fastest corrections occur when the currency starts to slip lower quickly. I have seen many crashes in different countries due to the currency devaluations, they are almost instantaneous, the current structure with no warning from the breath indicators etc very much follows the pattern. I watch the USD more than anything now...
I said this many times here and I repeat, the fastest corrections occur when the currency starts to slip lower quickly. I have seen many crashes in different countries due to the currency devaluations, they are almost instantaneous, the current structure with no warning from the breath indicators etc very much follows the pattern. I watch the USD more than anything now...
#3
fib_1618
-

- Traders-Talk User
- 10,145 posts
Member
Posted 14 March 2007 - 11:31 AM
I just read a piece on Market Tells by Rainsord Yang. He points out that the only other time in history we've seen three 90+% volume down days concentrated in a 3 week span was October of 1987.
There has been a lot of excitement in the market the past two weeks with respect to extreme up and down volume days. This study was promised to a few people to settle a disagreement for the consequences of extreme down volume days going forward. The intent was to post this study a few days ago, but family emergency issues delayed the report until now... not as timely as it could have been.
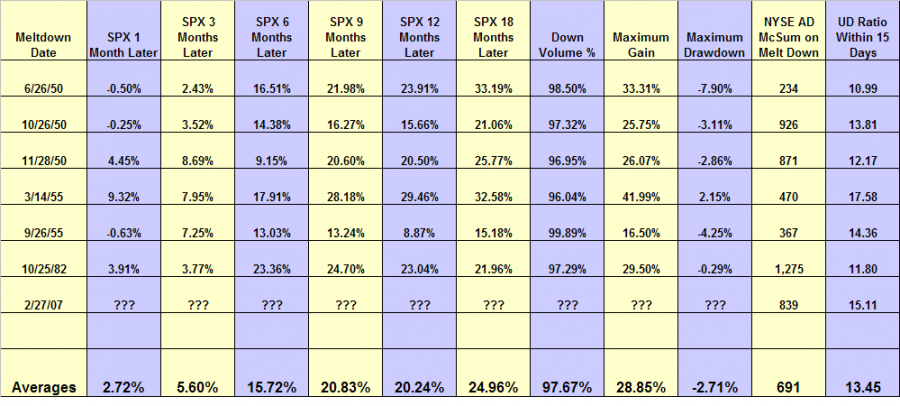
The study looks at longer term price returns following a lopsided down volume day as witnessed on February 27, 2007. The following filters are used to best replicate the market conditions leading up to the +95% down volume day on 2-27-07:
1) The 95% or more down volume day occurred within four weeks of a new six month high as measured by the S&P 500
2) The price changes were measured from the day the 95% down volume event transpired. Therefore in some cases, additional price degradation occurred prior to the event.
The following table lists all qualifying events since 1950 and includes the SPX change over arbitrary longer term, the maximum draw downs, and maximum gains in between the arbitrary time frames. For reference, the NYSE AD McSum value on the day of the melt down is included.
95% down volume days under these conditions similar to the recent market climate are rare, resulting in a small sample space... reducing its statistical significance, but the results are what they are, and provide doubt to notion such events are initiation moves to price collapses.

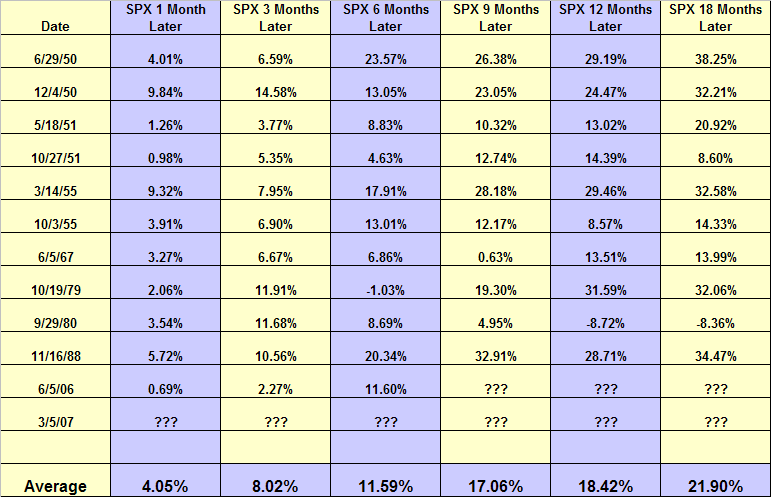
Since the first study's research was completed, a 90% down volume day unfolded on Monday March 5th (2007), thus another iteration of price return determinations were conducted with these filtering criteria:
1) Two 90% or more down volume days within a 10 day period.
2) The first down volume day occurs within four weeks of a new 6-month price high as measured by the SPX.
3) In this study, the price returns going forward were determined from the day the second 90% or more down volume day occurred.
The relaxed down volume percentage requirement from the first study provided a few more qualified sample points.
Of course, this time could be different, but past historical down volume extremes similar to the current market conditions, suggest the probability is high significant price appreciation will be the norm going forward in the longer term.
FWIW
Randy
Fib
Better to ignore me than abhor me.
“Wise men don't need advice. Fools won't take it” - Benjamin Franklin
"Beware of false knowledge; it is more dangerous than ignorance" - George Bernard Shaw
Demagogue: A leader who makes use of popular prejudices, false claims and promises in order to gain power.
Technical Watch Subscriptions
#4
Cirrus
-
- TT Patron+
- 5,735 posts
Member
Posted 14 March 2007 - 11:44 AM
Fib...
Article had a nice bullish slant and no data points conveniently included 1987. Again, I'm not a crash guy and I'm only marginally short overall. I do think there's more risk here than people think.
I've read Rainsford's stuff for 5+ years and he is unbiased and at best he's a trend following guy that has tended to be bullish much more often than bearish. Actually, he presented the two prior down days in the same slant as your article did...bullishly. That is until Tuesday came along.
Severe downside volatility during OPEX can sometimes get nasty. I'm just sitting mostly on the sidelines and looking to accumulate energy shares. I am observing the relative strength of the energy sector really pick up versus the rest of the market during the past few weeks. I think we're about to embark on another major up wave for the shares in the secular commodity bull.
I look at businesses like DDS and CTX and compare them to some of the energy businesses like COP, NOV, CVX and even a BWR.TO (zinc miner). Either metals prices will get cut in half (and even then BWR.TO is still a steel) and oil is going to 35$ or the market has it wrong.
There is a lot of really mispriced assets on Wallstreet given the secular backdrop of the world right now....A LOT. The market will work these and I think this 'correction' is part of it. Afterall...the market is preparing itself for a rate cut or two.
#5
sglasson
-

- Traders-Talk User
- 503 posts
Member
Posted 14 March 2007 - 11:45 AM
Which exchange? nyse, naz, amex etc. . .First let me state that I'm NOT predicting a crash. I just wanted to throw this out there because it is an anamoly.
I just read a piece on Market Tells by Rainsord Yang. He points out that the only other time in history we've seen three 90+% volume down days concentrated in a 3 week span was October of 1987.
#7
mortiz
-

- Traders-Talk User
- 277 posts
Member
Posted 14 March 2007 - 12:27 PM
Cirrus,
The study Fib copied did not include 1987 because 1987 did not qualify for the filtering used in the study, i.e. coming off a new six month price high, and the study was intended to look at events similar to what has transpired in recent weeks...
The October 1987 third +90% down volume day, basically marked the price bottom of the 1987 crash, that price low subsequently tested in December, 1987.
Your source needs to dig a bit deeper for other down volume events meeting the three week criterion, there are three others since 1960: 1965, 1978, and 1980, and many other examples if one includes the 1940s and 1950s. In 1978, a further price draw down of about 6% followed the third event, but in all other cases (except one in the 50s) the third day of 90% down volume within three weeks (since 1950) marked the price bottom for the down move.
This time can certainly be different, and due to the fact the normally wrong way small options players have been cleaning up in this decline, the probability of this time being different is higher than normal for seeing more price deterioration.
Randy
#8
Russ
-

- Traders-Talk User
- 7,199 posts
Member
Posted 14 March 2007 - 12:33 PM
"Nulla tenaci invia est via" - Latin for "For the tenacious, no road is impossible".
"In order to master the markets, you must first master yourself" ... JP Morgan
"Most people lose money because they cannot admit they are wrong"... Martin Armstrong
http://marketvisions.blogspot.com/
"In order to master the markets, you must first master yourself" ... JP Morgan
"Most people lose money because they cannot admit they are wrong"... Martin Armstrong
http://marketvisions.blogspot.com/
#9
Cirrus
-
- TT Patron+
- 5,735 posts
Member
Posted 14 March 2007 - 12:35 PM
Actually, my sourced looked back for the "40+ years of up/down volume statistics we have on file"--which means the early to mid 60's are the extent of his data.
Again, the action is very 'mysterious'. Huge volume on the exchanges with massive spikes in the OEX P/C which is the only P/C ration I really pay attention to these days. In fact it's a record breaking spike.
The fact that the NDX and RUT are hoding up very well today is a feather in the bulls cap....or esle it's just a lack of respect to the decline.
#10
wallyw
-

- Traders-Talk User
- 135 posts
Member
Posted 14 March 2007 - 12:37 PM
First let me state that I'm NOT predicting a crash. I just wanted to throw this out there because it is an anamoly.
I just read a piece on Market Tells by Rainsord Yang. He points out that the only other time in history we've seen three 90+% volume down days concentrated in a 3 week span was October of 1987.
there were similar episodes in 62, 66, 70 and a lot of other times.


