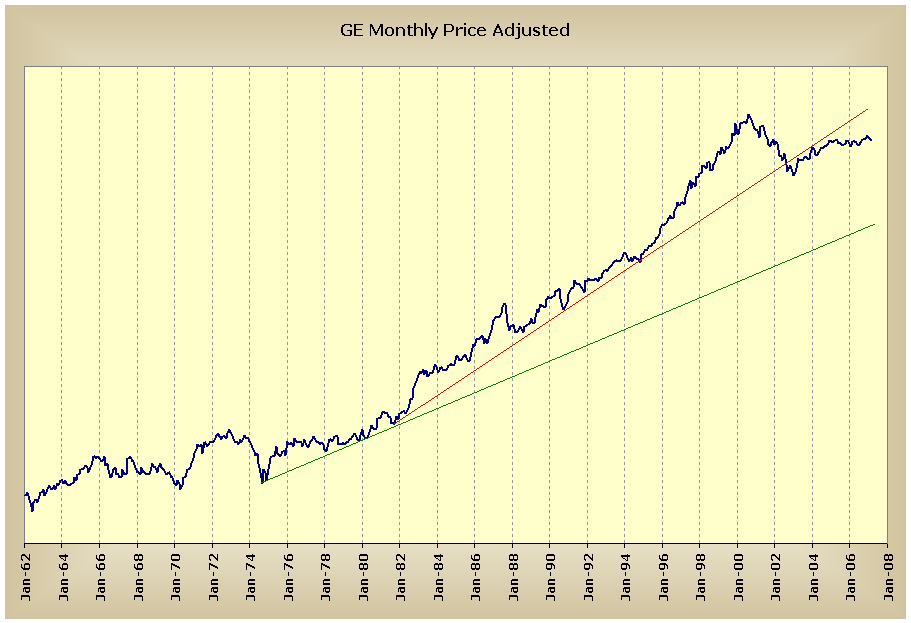
GE - 5 yr weekly
#1

Posted 18 March 2007 - 03:15 PM
The +DI should diverge with price before an IT top is in place. It has not at this point.
Next rally will give indication on GE's longer term picture.
http://stockcharts.c...8459&r=6878.png
http://www.trueworldhistory.info/
#2

Posted 18 March 2007 - 05:10 PM
#3

Posted 18 March 2007 - 05:26 PM
that trend line is coming from 1969 and it is passing through Feb 2006 low... entire rally since that low was a kiss of death... it is now in sweet spot .. similar formation resoled on home builders couple of months ago...
to get your clue, watch that 200ma taken out as if it is not even there...
just give it a few days.
now that is an ancient trend line. Can you post that on your blog??
muchas gracias, xD!
http://www.trueworldhistory.info/
#4

Posted 18 March 2007 - 06:07 PM
Well, think you need to take a look at the monthly - Huge volume here, note...we're about to break the last 2 volume highs on the monthly. On a long term basis, you have higher highs and higher lows on higher volume, a long term quality setup... I guess I can only find a couple negatives to watch. One is that last high volume low 28.88 can still be tested, and the 2nd being that if there is any chance at all that this is a distribution, you should see GE fall smartly back towards that last volume candle price (High-33.48) In fact, I'd insist that it closes inside that candle on the monthly to make any rational case of being short. There are still 10 trading days left in March. The benchmark volume is 876M. Right here we are at 456M. I suppose we could have the volume drop off a cliff and this turn into an upthrust, but I don't see the risk/reward setup yet on this one... Thanks for the tip I'll check in on it later in the month and watch for a move toward that 3/04 candle high...
Trading strategy: Wait for GE to break into the high of the candle(33.48)... you can short it there and set your stop there. That's a tight stop, but the price should be rejected vehemently if this is accumulation, and if not you could have yourself a nice pick. If you are wrong, it is for pennies. That's how we like em.
Edited by SemiBizz, 18 March 2007 - 06:14 PM.
Richard Wyckoff - "Whenever you find hope or fear warping judgment, close out your position"
Volume is the only vote that matters... the ultimate sentiment poll.
http://twitter.com/VolumeDynamics http://parler.com/Volumedynamics
#5

Posted 18 March 2007 - 06:11 PM
that trend line is coming from 1969 and it is passing through Feb 2006 low

Better to ignore me than abhor me.
“Wise men don't need advice. Fools won't take it” - Benjamin Franklin
"Beware of false knowledge; it is more dangerous than ignorance" - George Bernard Shaw
Demagogue: A leader who makes use of popular prejudices, false claims and promises in order to gain power.
Technical Watch Subscriptions
#6

Posted 18 March 2007 - 06:38 PM
Can you post that on your blog??
http://xtrends.blogs...on-with-ge.html
if you remind me, i can post a very large version of these charts tomorrow when the market is open...
Also I said it is coming from 1969, It should be 1970 not 69. My mistake.
Edited by xD&Cox, 18 March 2007 - 06:44 PM.
#7

Posted 18 March 2007 - 06:47 PM
#8

Posted 18 March 2007 - 06:53 PM
Edited by SemiBizz, 18 March 2007 - 06:56 PM.
Richard Wyckoff - "Whenever you find hope or fear warping judgment, close out your position"
Volume is the only vote that matters... the ultimate sentiment poll.
http://twitter.com/VolumeDynamics http://parler.com/Volumedynamics
#9

Posted 18 March 2007 - 08:19 PM
that trend line is coming from 1969 and it is passing through Feb 2006 low
Fib, is that a linear or semi-log chart? xD's trendline from 1970 would be far below today's price so I'm assuming this is a linear chart... much obliged. i'm assuming price-adjusted means for dividends, as well as splits?
regardless, that's a mighty big fall to that green trend line which would make for a gargantuan ABC down. seems like since the red trendline from 1982 is broken, its possible we may have put in a lower high, which would be confirmed once the 2002 trendline, which is where we are at right now, breaks and retest fails with a lower low.
Agree?
Edited by HiFiGuy, 18 March 2007 - 08:26 PM.
http://www.trueworldhistory.info/


