Now no one thinks we're raising rates, or so the media said so.
This RSI2 signal on the Qs has been 70% profitable. Well, it registered a sell today.
I see from the polls, many went long today.
I have mixed feelings on this signal. I think Wave B has started, which means we could test the highs. I'm still looking for evidence its Wave B tho. One way to tell is if it breaches highs while AD cum lags. Another is if odd-lot buying sky rockets. There's no strong evidence of either.
What I posted before was that last week, people went heavily short futures, and looks like many bailed on armageddon scenario.
So I have a bullish leaning, but the signal is fairly clean.. RSI2 sell is active as of today.
Position Symbol Shares Entry Date Entry Price Exit Date Exit Price % Change Net Profit Bars Held Profit/Bar Entry Signal Exit Signal Cum Profit MAE % MFE %
Short QQQQ 1,808 04/26/99 56.59 04/27/99 55.72 1.52 1,551.53 1 1,551.53 1,551.53 -1.23 2.79
Short QQQQ 1,816 06/21/99 56.71 06/22/99 55.00 3.00 3,091.17 1 3,091.17 4,642.70 -0.68 3.02
Short QQQQ 1,735 07/01/99 58.02 07/06/99 58.38 -0.64 -639.73 2 -319.87 4,002.97 -2.83 0.03
Short QQQQ 1,644 07/16/99 61.38 07/19/99 60.75 1.00 1,011.50 1 1,011.50 5,014.47 -0.41 1.41
Short QQQQ 1,661 08/25/99 61.50 08/26/99 60.48 1.65 1,684.03 1 1,684.03 6,698.50 -0.36 1.82
Short QQQQ 1,613 10/06/99 63.24 10/12/99 63.19 0.07 71.91 4 17.98 6,770.41 -2.71 1.96
Short QQQQ 1,498 11/04/99 67.50 11/17/99 72.88 -7.98 -8,067.75 9 -896.42 -1,297.34 -9.95 0.00
Short QQQQ 1,194 12/20/99 84.88 12/28/99 89.19 -5.10 -5,165.13 5 -1,033.03 -6,462.46 -10.25 0.28
Short QQQQ 1,047 01/21/00 96.25 01/24/00 91.25 5.18 5,219.00 1 5,219.00 -1,243.46 -1.43 5.49
Short QQQQ 1,032 02/07/00 98.41 02/09/00 99.00 -0.62 -628.49 2 -314.25 -1,871.95 -3.91 0.00
Short QQQQ 1,016 06/21/00 98.69 06/22/00 94.77 3.96 3,968.76 1 3,968.76 2,096.80 -0.32 3.97
Short QQQQ 994 07/17/00 101.44 07/18/00 99.25 2.14 2,158.88 1 2,158.88 4,255.68 0.00 3.04
Short QQQQ 1,011 08/31/00 101.88 09/05/00 99.52 2.30 2,368.95 2 1,184.48 6,624.63 -1.61 2.41
Short QQQQ 2,439 04/12/01 42.80 04/16/01 40.25 5.94 6,203.45 1 6,203.45 12,828.08 0.00 6.40
Short QQQQ 2,082 05/21/01 51.05 05/23/01 48.65 4.69 4,980.80 2 2,490.40 17,808.87 -1.76 4.72
Short QQQQ 2,284 06/28/01 44.35 07/05/01 43.45 2.01 2,039.59 4 509.90 19,848.46 -4.89 2.03
Short QQQQ 3,195 10/05/01 31.76 10/09/01 31.09 2.09 2,124.65 2 1,062.33 21,973.12 -1.86 2.80
Short QQQQ 2,826 10/25/01 36.80 10/26/01 36.01 2.13 2,216.54 1 2,216.54 24,189.66 -0.71 2.15
Short QQQQ 2,720 11/06/01 38.19 11/08/01 37.75 1.14 1,180.80 2 590.40 25,370.46 -3.17 2.46
Short QQQQ 2,654 03/08/02 38.67 03/12/02 38.00 1.72 1,762.18 2 881.09 27,132.63 -1.34 3.49
Short QQQQ 4,500 10/14/02 22.48 10/16/02 22.78 -1.35 -1,366.01 2 -683.00 25,766.63 -5.13 1.82
Short QQQQ 3,861 11/05/02 26.10 11/07/02 25.54 2.13 2,146.16 2 1,073.08 27,912.78 -1.95 3.03
Short QQQQ 3,799 01/07/03 26.65 01/08/03 25.90 2.80 2,833.25 1 2,833.25 30,746.03 -1.20 3.04
Short QQQQ 3,888 03/17/03 26.60 03/24/03 26.04 2.09 2,161.28 5 432.26 32,907.31 -4.36 2.37
Short QQQQ 3,715 04/22/03 27.43 04/25/03 26.95 1.73 1,767.20 3 589.07 34,674.51 -1.17 2.08
Short QQQQ 3,426 05/29/03 29.31 06/02/03 29.58 -0.94 -941.02 2 -470.51 33,733.49 -3.04 0.00
Short QQQQ 3,287 06/05/03 30.64 06/06/03 30.13 1.65 1,660.37 1 1,660.37 35,393.86 -2.71 2.02
Short QQQQ 3,208 08/18/03 31.97 08/22/03 32.44 -1.49 -1,523.76 4 -380.94 33,870.10 -4.38 0.39
Short QQQQ 3,022 08/29/03 33.39 09/05/03 33.94 -1.66 -1,678.10 4 -419.52 32,192.00 -2.85 0.78
Short QQQQ 2,904 10/07/03 34.65 10/08/03 34.43 0.62 622.88 1 622.88 32,814.89 -0.55 1.24
Short QQQQ 2,838 10/14/03 35.33 10/15/03 35.18 0.41 409.70 1 409.70 33,224.59 -1.47 0.85
Short QQQQ 2,826 12/01/03 35.90 12/02/03 35.70 0.54 549.20 1 549.20 33,773.79 -0.42 0.89
Short QQQQ 2,678 01/07/04 37.68 01/09/04 37.73 -0.15 -149.90 2 -74.95 33,623.89 -1.78 0.24
Short QQQQ 2,695 04/05/04 37.45 04/06/04 36.98 1.24 1,250.65 1 1,250.65 34,874.55 0.00 1.42
Short QQQQ 2,836 05/25/04 35.96 06/02/04 36.42 -1.29 -1,320.56 5 -264.11 33,553.99 -1.95 0.42
Short QQQQ 2,811 09/14/04 35.63 09/15/04 35.25 1.04 1,043.75 1 1,043.75 34,597.74 0.00 1.49
Short QQQQ 2,770 10/04/04 36.31 10/07/04 36.24 0.19 186.20 3 62.07 34,783.95 -1.75 0.56
Short QQQQ 2,691 11/03/04 37.41 11/10/04 37.79 -1.03 -1,038.58 5 -207.72 33,745.36 -2.00 0.80
Short QQQQ 2,587 11/15/04 38.83 11/16/04 38.59 0.59 597.13 1 597.13 34,342.49 0.00 1.31
Short QQQQ 2,496 12/03/04 40.13 12/07/04 39.58 1.35 1,356.80 2 678.40 35,699.29 -0.92 1.50
Short QQQQ 2,799 05/05/05 35.76 05/10/05 35.77 -0.03 -32.80 3 -10.93 35,666.49 -0.84 0.39
Short QQQQ 2,741 05/17/05 36.70 05/25/05 37.81 -3.04 -3,058.51 6 -509.75 32,607.98 -3.54 0.00
Short QQQQ 2,623 07/12/05 38.30 07/18/05 38.73 -1.15 -1,151.77 4 -287.94 31,456.21 -1.83 0.34
Short QQQQ 2,524 09/12/05 39.73 09/13/05 39.63 0.24 236.40 1 236.40 31,692.61 -0.45 0.48
Short QQQQ 2,534 10/03/05 39.56 10/04/05 39.30 0.64 642.85 1 642.85 32,335.46 -0.81 0.68
Short QQQQ 2,504 11/04/05 40.08 11/15/05 40.52 -1.11 -1,117.76 7 -159.68 31,217.70 -2.09 0.40
Short QQQQ 2,413 11/21/05 41.55 11/28/05 41.54 0.01 5.71 4 1.43 31,223.42 -1.13 0.45
Short QQQQ 2,385 01/06/06 42.68 01/12/06 43.00 -0.77 -779.20 4 -194.80 30,444.22 -1.48 0.37
Short QQQQ 2,347 04/06/06 42.73 04/07/06 42.32 0.94 946.27 1 946.27 31,390.49 -0.75 1.01
Short QQQQ 2,592 08/17/06 38.73 08/21/06 38.42 0.78 787.52 2 393.76 32,178.01 -0.26 1.21
Short QQQQ 2,582 08/30/06 38.91 09/06/06 38.67 0.60 603.68 4 150.92 32,781.70 -1.46 0.77
Short QQQQ 2,503 09/14/06 39.99 09/19/06 39.85 0.33 334.43 3 111.48 33,116.13 -1.18 1.18
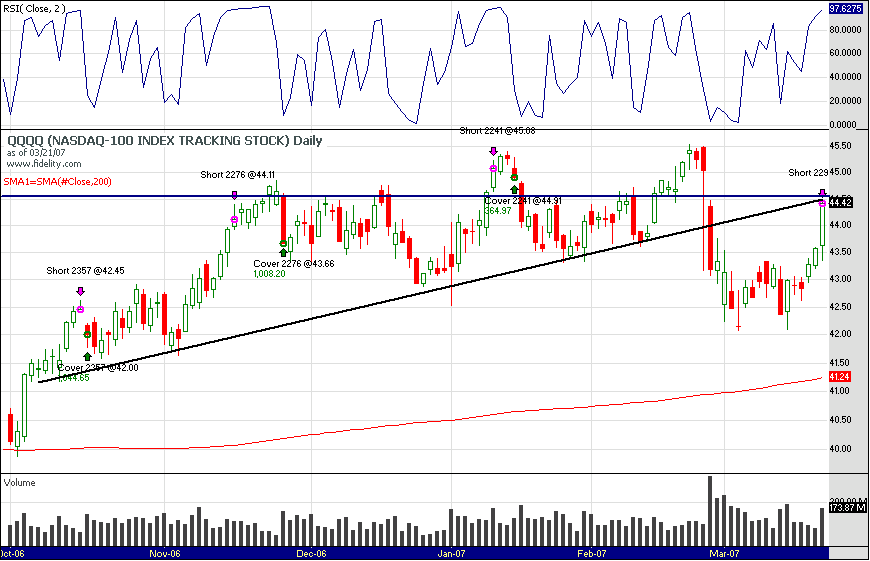
Short QQQQ 2,357 10/16/06 42.45 10/17/06 42.00 1.04 1,044.65 1 1,044.65 34,160.78 0.00 1.63
Short QQQQ 2,276 11/15/06 44.11 11/27/06 43.66 1.00 1,008.20 7 144.03 35,168.98 -1.70 1.07
Short QQQQ 2,241 01/11/07 45.08 01/17/07 44.91 0.36 364.97 3 121.66 35,533.95 -0.71 0.55
Short QQQQ 2,295 03/21/07 44.42 Open Open -0.01 -8.00 1 -8.00 35,525.95 0.00 0.00