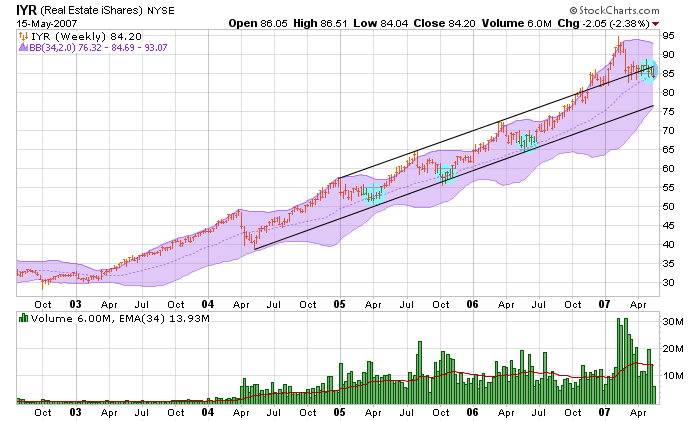
IYR - note the MA being tested today on the weekly vs. what has happened on such tests in the past...what will happen this time?
http://stockcharts.c...allery.html?iyr
also, note price action vs. support t/l on the long-term weekly

IYR weekly
Started by
hiker
, May 16 2007 11:19 AM
11 replies to this topic
#3

greenie
-

- Traders-Talk ~
- 3,184 posts
Member
Posted 16 May 2007 - 11:30 AM
Some components:
http://stockcharts.c...2297&r=360&.png
http://stockcharts.c...5513&r=485&.png
http://stockcharts.c...782&r=6838&.png
Are they saying 'this time is different' ? I think so.
http://stockcharts.c...2297&r=360&.png
http://stockcharts.c...5513&r=485&.png
http://stockcharts.c...782&r=6838&.png
Are they saying 'this time is different' ? I think so.
It is not the doing that is difficult, but the knowing
It's the illiquidity, stupid !
It's the illiquidity, stupid !
#4
hiker
-
- TT Member*
-

- 12,118 posts
independent trader
Posted 16 May 2007 - 11:35 AM
note 81 to 81.99 box on PnF chart...a move to that box would confirm the PnF chart flip from bullish to bearish that would be signaled earlier..will it occur?
http://stockcharts.c...allery.html?iyr
a REIT sector chart here -
http://forums.techni...post?id=1890590
http://stockcharts.c...allery.html?iyr
a REIT sector chart here -
http://forums.techni...post?id=1890590
#5
Cirrus
-

- TT Patron+
- 5,735 posts
Member
Posted 16 May 2007 - 11:41 AM
Who knows--but I'll be watching. I will cover a little in the high 81s as it's strong support and wait.
Again--the XAU is forecasting "muy malo" things for the markets over the ST to IT. I'm beginning to think the ever so popular June/July scenario materializes.
#6
hiker
-
- TT Member*
-
- 12,118 posts
independent trader
Posted 16 May 2007 - 11:48 AM
covered the IYR short on this move just now below 83..too many leaning short for too long....will give it a rest.
now right at the bearish breakout on the PnF chart pattern.
200-day sma below day low so far
who knows is right. I was heavy in this one.
Edited by hiker, 16 May 2007 - 11:53 AM.
#7
HiFiGuy
-

- Traders-Talk User
- 174 posts
Member
Posted 16 May 2007 - 11:53 AM
the performance of the REIT sector vs. SPX appears to have changed for the IT/LT. I would expect a bounce here given that we're up against the lower BB. But with the 200 sma flattening, we'll need to see if the extent of the bounce to see if the LT trend begins to decline.
my 2c, fwiw.
http://stockcharts.com/c-sc/sc?s=$REIT:SPY&p=D&yr=2&mn=2&dy=0&i=p72023731990&a=106817921&r=743.png
my 2c, fwiw.
http://stockcharts.com/c-sc/sc?s=$REIT:SPY&p=D&yr=2&mn=2&dy=0&i=p72023731990&a=106817921&r=743.png
"A state of war only serves as an excuse for domestic tyranny." - Aleksandr Solzhenitsyn
http://www.trueworldhistory.info/
http://www.trueworldhistory.info/
#8
fib_1618
-

- Traders-Talk User
- 10,145 posts
Member
Posted 16 May 2007 - 12:15 PM
I'm adding this chart I recently annotated from an ongoing discussion at TW.
I'm sure Greenie is a happy camper today.
Fib
Old post Yesterday at 08:51 PM Email PM Reply
In a five year weekly chart, IYR stayed within a price channel. It broke out of the channel upwards during early Feb in a parabolic pattern....Mean reversion is a viable principle for long term.
OK, shown below is a five year chart of the IYR with the price channel you've noted marked on the chart. I've also applied a 34 day MA Bollinger Band to the pattern to provide a longer term "mean" to the pattern.
Some observations from the technical side:
1) You'll notice that the price pattern gaped up above the upper end of the trend channel in mid November of 2006. However, this move above and away from the previous trend was not accompanied by expanding volume which suggested that either a failure would occur, or minimally speaking, a snap back to the breakout line would be needed to test the conviction of this same move. You will notice that a retest did occur into the end December period before again moving higher.
2) The rally from the beginning of this year did not enjoy much in the way of volume expansion which is a key prerequisite for a speculative blow-off. The increase in volume actually came at the top with the range close reversal and peaked with the price pattern reversal on the second retest of the previous upper trend channel line.
3) Next you'll note that through yesterdays action that the price pattern seems to be trading back within the previous trend channel which suggests that "something different" might be happening with the longer term pattern and why the reference to another possible leg down near term was mentioned earlier in the thread.
4) Also of note is the way the price pattern has been able to move back to its mean and found support since the start of the trend channel back in May of 2004. Will it hold this time as it has in the past? With the price action having moved back within the trend channel, the chances of this happening this time around are decreased by an appropriate technical amount based on all things being equal.
5) Tuesday's action saw a move to the downside as was the technical expectation because of the reasons given above. However, volume is woefully low if one were looking for a bearish continuation to the downside. But then again, this is a weekly chart, and it's early in the week.
The bottom line from a technical standpoint is that the trend of this chart pattern remains higher, but the longer it remains back within the trend channel, the better the chance that a test of the lower Bollinger Band will occur. If this does happen, and the bounce off the lower band is not able to move above the 34 day "mean", then this will be your first real confirmation that a change of trend is actually underway.
The problem with your method of counting sectoral advance-decline is that it considers all stocks in the same manner, without showing any respect for strong or weak stocks.
Actually, the beauty of considering all the components in this manner is that it gives you a better way to weigh an overall sectors relative strength as compared to the general marketplace, with no prejudice to how big or how small your weight is, only that money regards the sector as being worthy of attention (sometimes positive, sometimes negative) to ones own money making pursuits.
Fib
I'm sure Greenie is a happy camper today.
Fib
Better to ignore me than abhor me.
“Wise men don't need advice. Fools won't take it” - Benjamin Franklin
"Beware of false knowledge; it is more dangerous than ignorance" - George Bernard Shaw
Demagogue: A leader who makes use of popular prejudices, false claims and promises in order to gain power.
Technical Watch Subscriptions
#9
arbman
-

- Traders-Talk User
- 19,504 posts
Quant
Posted 16 May 2007 - 12:54 PM
This is a major slide... It will eventually effect all of the indices... The bounce in DJR (or IYR) will be the reason of the next rally, then I believe it will pull everything down with it. This is the ultimate sign that the liquidity is majorly drying now ahead...
#10
Cirrus
-
- TT Patron+
- 5,735 posts
Member
Posted 16 May 2007 - 01:03 PM
This is a major slide... It will eventually effect all of the indices... The bounce in DJR (or IYR) will be the reason of the next rally, then I believe it will pull everything down with it. This is the ultimate sign that the liquidity is majorly drying now ahead...
Agree--this along with the XAU which is just acting terribly. I still think this will be a 1998esque mid-cycle slowdown. I can't wait to load the boat on the golds, energies and some industrial metals stocks later this summer.
The monthly charts in the energy sector look absolutely wonderful......most coming off of very nice monthly bases in the form of bull flags and some are begining to challenge old highs.


