at the my big count....if we need one more high...target is 1549/50
http://stockcharts.com/c-sc/sc?s=$SPX&p=D&yr=8&mn=0&dy=0&i=p50387844942&a=99807757&r=3357.png

Time for another glance....
Started by
eminimee
, Jun 18 2007 12:45 PM
9 replies to this topic
#1

eminimee
-
- TT Member
- 14,307 posts
I don't care who's fur is flying...
Posted 18 June 2007 - 12:45 PM
#2
hiker
-

- TT Member*
-

- 12,118 posts
independent trader
Posted 18 June 2007 - 12:47 PM
you consider SPX cash 1532.50 in play or was that price level relevance voided by Friday's action?
..thanks again as always
#3
linrom1
-

- Traders-Talk User
- 4,027 posts
Member
Posted 18 June 2007 - 12:54 PM
at the my big count....if we need one more high...target is 1549/50
http://stockcharts.com/c-sc/sc?s=$SPX&p=D&yr=8&mn=0&dy=0&i=p50387844942&a=99807757&r=3357.png
This is some bullish pattern: 1700-1950 top of wave 5?
#4
eminimee
-
- TT Member
- 14,307 posts
I don't care who's fur is flying...
Posted 18 June 2007 - 01:05 PM
Not sure I know what you mean by "in Play"...we moved below that this morning....I think we are in a triangle but the bottom of it may not be defined yet....If it is defined...we shouldn't move south of todays low and the triangle is a 4th wave pull back.
linrom.....1800/1810 minimum....that would be approx. when OEX hit's it's all time high.
Edited by Teaparty, 18 June 2007 - 12:59 PM.
#5
hiker
-
- TT Member*
-
- 12,118 posts
independent trader
Posted 18 June 2007 - 01:15 PM
TP....in your prior posts last week you had mentioned 32.50 as a key level for monitoring...my memory without checking your post was that was your first potential upside tgt. So, I will assume since it was reached it is no longer relevant, or other price levels are now relevant
#6
eminimee
-
- TT Member
- 14,307 posts
I don't care who's fur is flying...
Posted 18 June 2007 - 01:18 PM
Sorry Hiker....I can't remember anything about 32.50 spx....sure it was me?.....or I'm just losing my memory. lol
#7
fib_1618
-

- Traders-Talk User
- 10,145 posts
Member
Posted 18 June 2007 - 01:32 PM
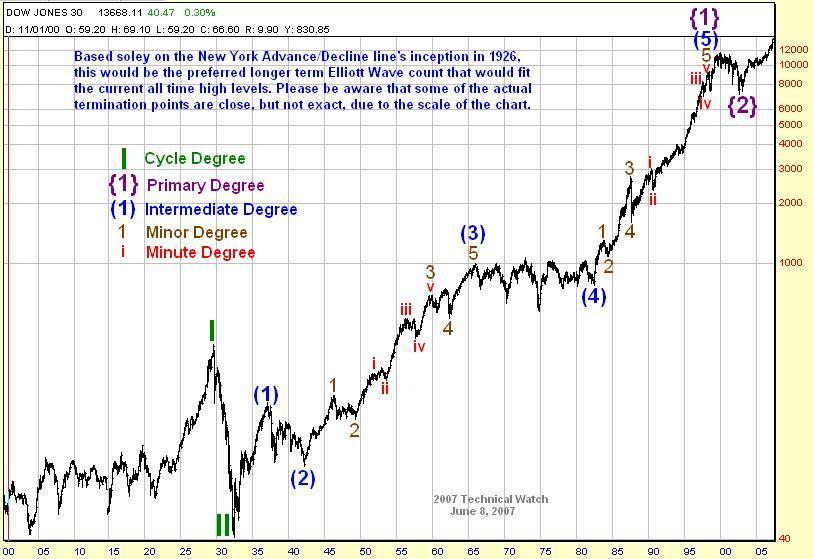
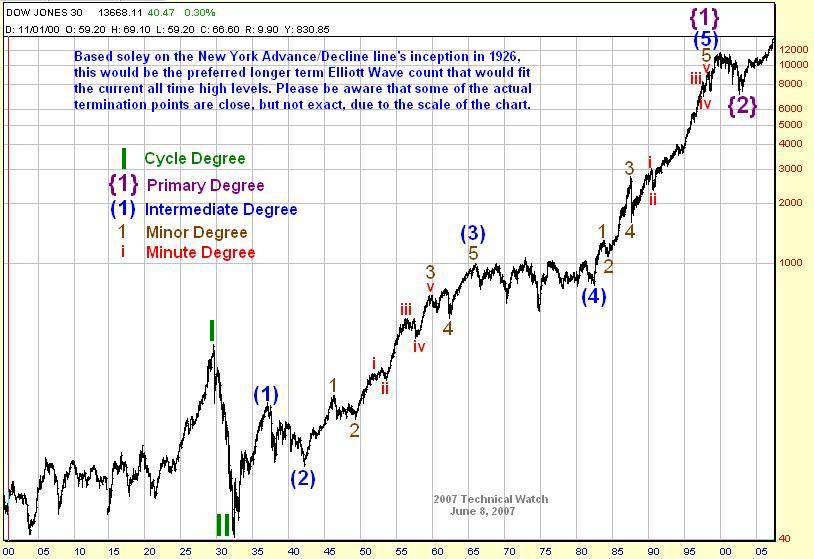
1) So that it's more understandable, what degree of count is marked by your 1 at the 2000 top? Going by your count in parenthesis in 2005 (being that of intermediate degree), would the Red indicate that of Cycle degree?
2) The key in knowing if a 4th wave of the same degree is tracing out is that momentum tools, such as the MACD, will generate lower lows than that of the second wave bottom within this same pattern sequence. So until this happens, you're probably looking at further sub division of the current pattern.
Aside from that, and the running correction consideration you have in 2005 (which I'm not a big fan of), the count "looks" plausible, especially if the A/D line tops out in here. However, your triple three decline in the 2000-2003 period is questionable based on the fact that the March 2003 lows were able to generate higher anxiety ratings than that of the actual 2002 lows...which would mean that it's more than likely a second wave bottom.
We're you able to check out the multi decade Dow count proposal I put up last week?
Fib
Better to ignore me than abhor me.
“Wise men don't need advice. Fools won't take it” - Benjamin Franklin
"Beware of false knowledge; it is more dangerous than ignorance" - George Bernard Shaw
Demagogue: A leader who makes use of popular prejudices, false claims and promises in order to gain power.
Technical Watch Subscriptions
#8
hiker
-
- TT Member*
-
- 12,118 posts
independent trader
Posted 18 June 2007 - 01:34 PM
TP...here is one of several mentions of that price area...cannot find the one I am thinking you mentioned 32.50 in more detail
32.50 was mentioned in shorter timeframe than the subject of big count in the current thread..sorry to confuse
http://www.traders-t...showtopic=71384
32.50 was mentioned in shorter timeframe than the subject of big count in the current thread..sorry to confuse
http://www.traders-t...showtopic=71384
Edited by hiker, 18 June 2007 - 01:39 PM.
#9
eminimee
-
- TT Member
- 14,307 posts
I don't care who's fur is flying...
Posted 18 June 2007 - 01:48 PM
Fib...to be honest....I'm not at all sure about that RED 1 at the 2000 top....it could be a 3 and the 2003 low was 4...the purpose of even putting a number there is to stress the bullish count....I missed your multi decade Dow post so if you could direct me to it....I might be able to get a bit clearer on that.
As far as the running correction in 2005...I like it...and you might too if you look at OEX.....it double bottomed in 05 while spx made that C wave as marked.
If you could link me to your post I'd be grateful.
Cheers.
C.
Hiker...OK....1532.50 was the kissback to the bottom of a possible channel...now that we have taken it out to the upside.....it's no longer on my watch. Now concentrating on another high near 1550 or taking out 1515 south on a close.
#10
hiker
-
- TT Member*
-
- 12,118 posts
independent trader
Posted 18 June 2007 - 01:49 PM
thanks for your current view on the 32.50
link to Dow chart -


