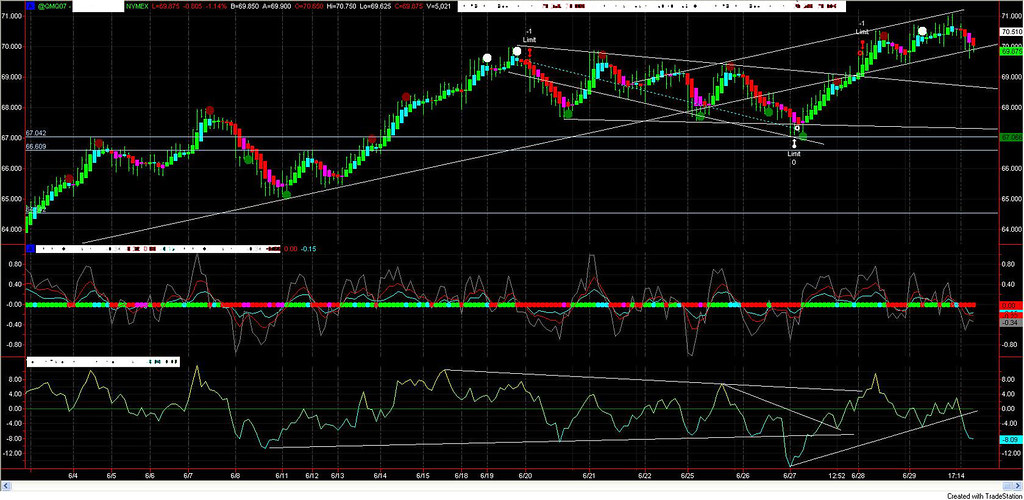
Looks like the bullish scenario mentioned Here is winning out so far, but we're now in the time window to look for a pullback of some sort....correction takes us timewise into early-to-mid August.
Updated charts
Daily, price far short of the bullish fractal target, but we're there timewise
Weekly with further room above until the next channel line should the rally continue
Crude Watch
Started by
VolPivots
, Jul 01 2007 09:17 PM
1 reply to this topic
#1
Posted 01 July 2007 - 09:17 PM
#2
Posted 02 July 2007 - 10:29 AM
Great post. Thanks for sharing these charts.
I trade the MINY Crude. The system I used based on the RSI posted and price movement posted a short signal this morning. My first profit target is around 68.70 although, I would not be surprised to see it reach for 72 before turning down.
Link to Oil Chart
I trade the MINY Crude. The system I used based on the RSI posted and price movement posted a short signal this morning. My first profit target is around 68.70 although, I would not be surprised to see it reach for 72 before turning down.
Link to Oil Chart