Trading Malpractice
#11

Posted 07 July 2007 - 04:04 PM
#12

Posted 07 July 2007 - 04:07 PM
~Benjamin Franklin~
#13

Posted 07 July 2007 - 04:17 PM
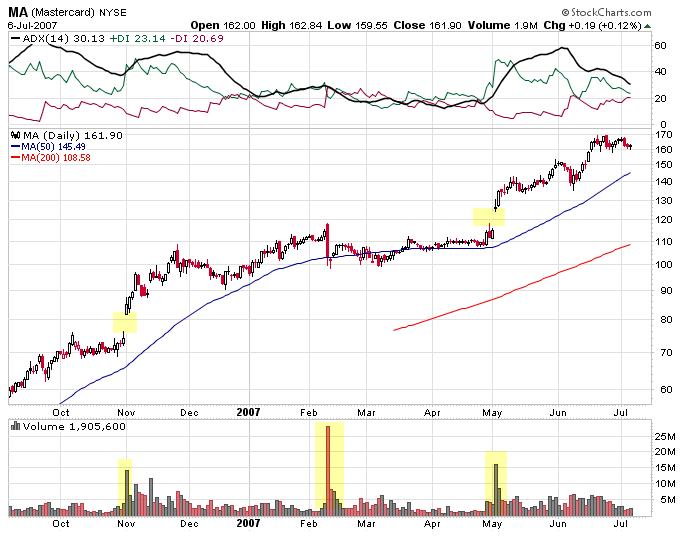
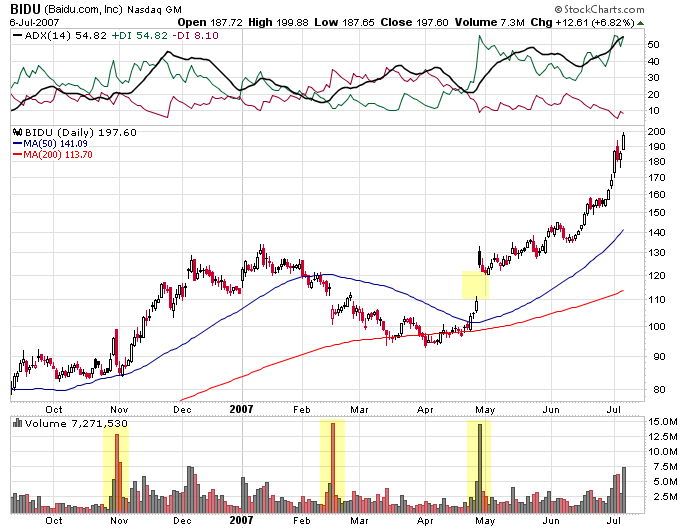
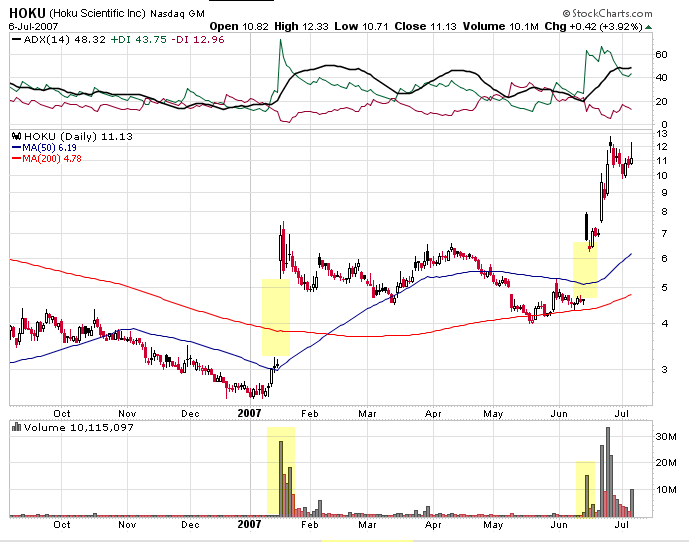
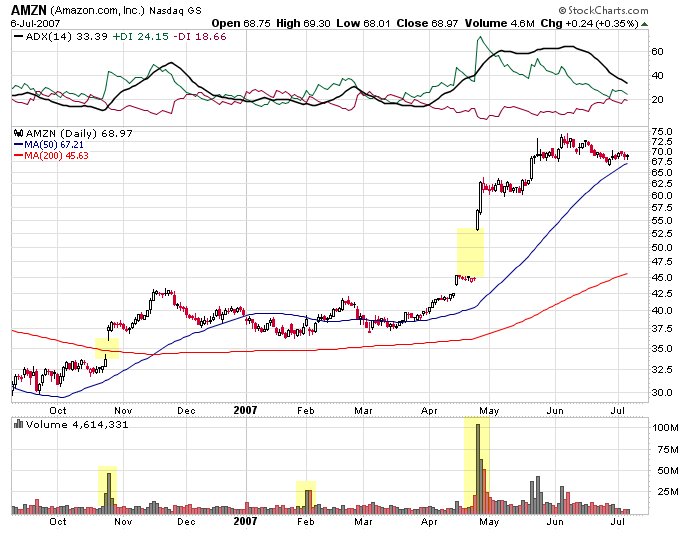
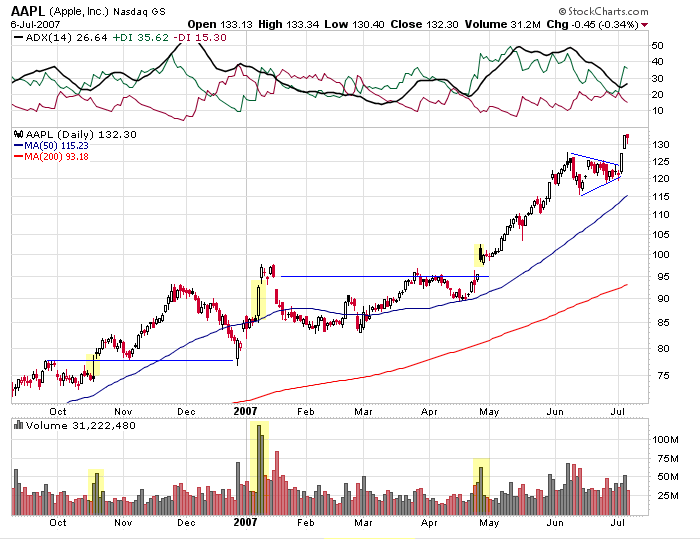
A major volume thrust and gap. Usually a mid-cycle heavy volume shakeout which is
accumulated by the specialists or market makers, followed by another high volume gap up.
#14

Posted 07 July 2007 - 04:24 PM
U.F.O.
~Benjamin Franklin~
#15

Posted 07 July 2007 - 04:32 PM
Challenge example. Anyone who lived through the 2000 NASDAQ collapse learned a thing or two. During the last, monstrous push to the all-time highs, volume fell to a cyclical low. Here's one example, INTC. I can go find another several hundred charts if this is insufficient. A rally on low volume is usually a negative sign...not a positive one. (1 chart)
U.F.O.
Thanks for proving my point with your chart.
Ummm let's see, volume in INTC peaked in 1993 with the stock at $5 and "bearishly" diverged by declining as prices rose 1400% to $75 over the next 7 years. And that is supposed to prove that low volume rallies are bearish!?!?!?
You can't possibly be serious.
Any fool who shorted INTC from 1993 through 2000 becuase of the "bearish" low volume was a cadaver by the 2000 top.
Give me a break are you guys that friggin clewless?
Need a more recent example? How about the rally from the July 2006 low? All I heard about from message board amateurs was how the rally was destined to fail because there was no volume.
Wrong again.
Problem with all this "junk science" volume analysis is that it ASSumes that the low volume is due to lack of buyers. But if that was the case then prices would be falling wouldn't they. Did you guys forget the basic laws of supply and demand? Low volume rallies mean one thing and one thing only. NO SELLERS=NO SUPPLY. Prices will rise until it brings in supply to meet the demand. That is econ 101 folks.
How high will prices have to rise to entice the sellers and create the supply? Will it be 7 years and 1400% like in the INTC example above? Your guess is as good as mine. Except I ain't trying to guess. I'm just riding the trend. I'll let the tape gamblers lose all their money picking tops because of low volume
Edited by DonBart, 07 July 2007 - 04:34 PM.
#16

Posted 07 July 2007 - 04:55 PM
Mark S Young
Wall Street Sentiment
Get a free trial here:
http://wallstreetsen...t.com/trial.htm
You can now follow me on twitter
#17

Posted 07 July 2007 - 04:58 PM
~Benjamin Franklin~
#18

Posted 07 July 2007 - 05:05 PM
Mark S Young
Wall Street Sentiment
Get a free trial here:
http://wallstreetsen...t.com/trial.htm
You can now follow me on twitter
#19

Posted 07 July 2007 - 05:55 PM
The Intel's charts is a prime example in the proper time frame, the stock went up for 7 years on declining volume and it gave most of them back in the following 7 years.
On the way up, every rally that started on low volume, basically got sold off, but the demand emerged on the way down and accumulated. The participants accumulated the declines mainly. So, the retracements were usually deep...
As you see, the volume on Intel increased heavily as the prices moved up in early 1995 and throughout 1996 and Intel is still trading above those prices.
So, relatively speaking %20 difference or between heavy and light volume cases. This was my experience, I would appreciate, if somebody can explain me why in case I am wrong. I backtested these in my systems and usually got better than 50% success ratio. In some cases as much as 70% success rate...
Rallies out of a low;
- heavy volume low, ligh volume rally = expect good retracement, uptrend usually resumes.
- light volume low, light volume rally = expect good retracement, could be top.
- heavy volume low, rally with increasing volume = expect shallow retracement, uptrend usually resumes.
- light volume low, rally with increasing volume = expect shallow retracement, usually very bullish.
- light volume high, decline on heavy volume = expect deep or full retracement, hard to bounce without a light volume retest of the lows.
- heavy volume high, decline on light volume = expect shallow retracement, usually uptrend resumes.
- heavy volume high, heavy volume decline = expect full retracement, usually very bearish, sell any light volume rally out of it.
- light volume high, decline on light volume = lack of interest, indecisive.
#20

Posted 07 July 2007 - 06:19 PM


