U.F.O.

Shorted RYDEX
Started by
U.F.O.
, Jul 09 2007 09:14 PM
13 replies to this topic
#1

Posted 09 July 2007 - 09:14 PM
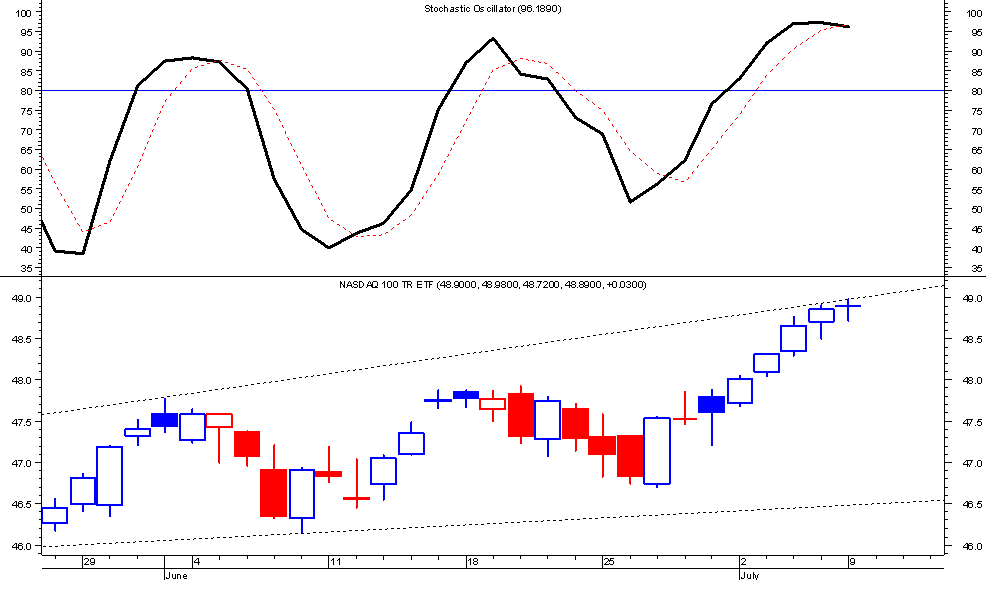
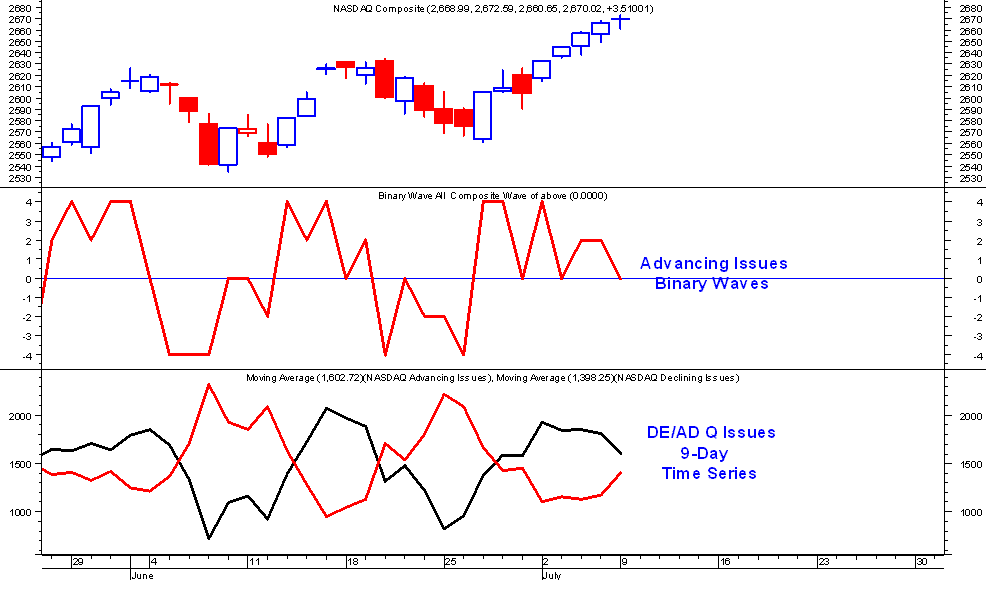
50% short. (2 charts)
U.F.O.


U.F.O.
"Democracy is two wolves and a lamb voting on what to have for lunch. Liberty is a well-armed lamb contesting the vote!"
~Benjamin Franklin~
~Benjamin Franklin~
#2

Posted 09 July 2007 - 09:28 PM
I like that last candle at the top of the chart. Certainly shows the markets indecision and it's banging right against resistance.
Which gives me an idea for an optimization. LAUGH.  Searcing for those Doji type candles where the open and close virtually identical and up against, say the seconnd or third standard deviation which should be the top of the channel. You would think that might come up with a statistical advantage. But you know, that's a pretty basic approach, very obvious, so perhaps there is no real long term advantage?
I may have to check out out some day for fun, if nothing else.
Edited by Sentient Being, 09 July 2007 - 09:28 PM.
In the end we retain from our studies only that which we practically apply.
~ Johann Wolfgang Von Goethe ~
~ Johann Wolfgang Von Goethe ~
#3

Posted 09 July 2007 - 09:32 PM
Steve...I love your style. Keep me posted.
U.F.O.
"Democracy is two wolves and a lamb voting on what to have for lunch. Liberty is a well-armed lamb contesting the vote!"
~Benjamin Franklin~
~Benjamin Franklin~
#4

Posted 09 July 2007 - 09:36 PM
UFO,
What are those binary waves? From the chart you showed a few times I am sensing that a x-over of the 0 is a negative sign, but can you explain what those are?
thnx!
“be right and sit tight”
#5

Posted 09 July 2007 - 09:45 PM
The Binary Wave
A Binary Wave plots +1 or -1, depending on whether the indicator it interprets is bullish or bearish. (The term "Binary Wave" is based on this ±1 concept.) The real power of Binary Waves occurs when multiple Waves are combined into composite Binary Waves.
Binary Waves are the opposite of black box trading systems (although both are considered "expert systems"). You don't know the rules or indicators that are used to analyze securities in a black box. Conversely, you specify the rules and indicators in a Binary Wave.
Example Binary Waves
The following table shows the rules used in four Binary Wave indicators.
(In an effort to keep these examples understandable, we only use four Waves and fairly simple criteria. However, you could, and probably should modify the criteria based on your own expertise.)
Indicator Bullish Bearish
MACD > signal line <= signal line
Moving Average close > Moving Avg. Close <= Moving Avg.
Rate-Of-Change Rate-Of-Change > 0 Rate-Of-Change <= 0
Stochastic > 50 <= 50
As shown in this table, we consider the MACD bullish when it is above its signal line and bearish when it is equal to, or falls below, its signal line. Thus, the MACD Binary Wave will plot ±1 depending on whether the MACD is above or below its signal line. This same concept is used to develop three additional Binary Waves that plot ±1 based on the action of the other indicators.
We will then combine the four Binary Waves into a composite Binary Wave. When all four Binary Waves are bullish, the value of this composite Binary Wave will be +4; when all four Binary Waves are bearish, its value will be -4; when two are bullish and two are bearish, its value will be zero.
Summary
Binary Waves display your evaluation of an indicator (e.g., "it is bullish when the MACD is above its 9-period moving average") as a ±1 indicator. Composite Binary Waves combine multiple Binary Wave indicators to illustrate your analysis of a security based on the actions of numerous indicators.
"Democracy is two wolves and a lamb voting on what to have for lunch. Liberty is a well-armed lamb contesting the vote!"
~Benjamin Franklin~
~Benjamin Franklin~
#6

Posted 09 July 2007 - 09:48 PM
"But you know, that's a pretty basic approach, very obvious, so perhaps there is no real long term advantage?"
My experience is that the obvious usually pays. Ever notice how hard the media, newsletters, sentiment miners, ect,-try to talk you out of an obvious truth? Give it a shot, I'd love to see what you come up with.
Spooky
#7

Posted 09 July 2007 - 09:49 PM
thnx ufo! i cant find anything like that in tradestation, looks cool.
“be right and sit tight”
#8

Posted 09 July 2007 - 09:52 PM
Thx. rkd. One of the few advantages I get from Metastock over other trading systems. If you like it, I'll keep posting it. Best.
U.F.O.
"Democracy is two wolves and a lamb voting on what to have for lunch. Liberty is a well-armed lamb contesting the vote!"
~Benjamin Franklin~
~Benjamin Franklin~
#9

Posted 09 July 2007 - 10:06 PM
i do like it! how reliable is that cross-over? it appears that any down day tomorrow could trigger it and apparently forecast a minor sell-off.
“be right and sit tight”
#10

Posted 09 July 2007 - 10:18 PM
NDX
5min sell..........S@1985 ..........may turn 15-60 min buy into sell
15-60-dly-wkly.... buy
QID........5min buy
QLD......5min sell
Edited by vitaminm, 09 July 2007 - 10:24 PM.
vitaminm


