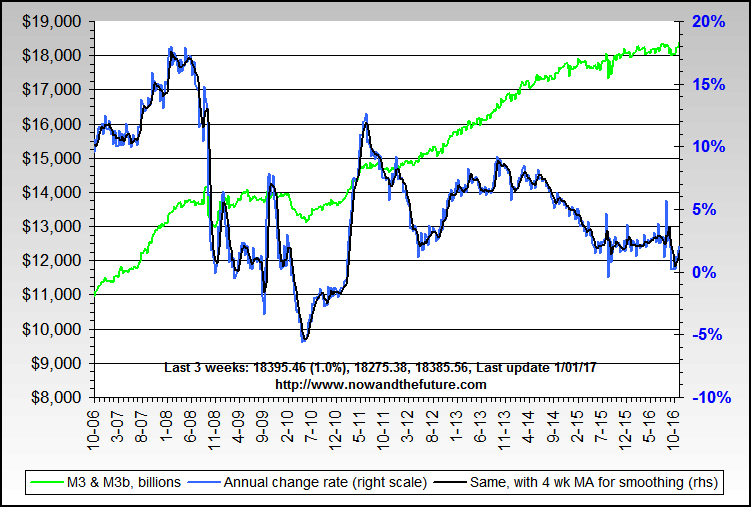

Peak Liquidity?
Started by
spielchekr
, Jul 13 2007 06:32 PM
5 replies to this topic
#1

Posted 13 July 2007 - 06:32 PM
Lower lows have have been uncommon and shallow on this chart.


#2

Posted 13 July 2007 - 07:08 PM
ED? Wolfe wave?


#3

Posted 13 July 2007 - 07:29 PM
I need to complete my thought. That chart is a little behind. Are wolfe waves limited to five points? If it can "extend", can a 7th wave that exceeds the support line like the 5th wave mentioned below be considered the entry point?

Current USD weekly status:


Current USD weekly status:

#4

Posted 14 July 2007 - 02:16 PM
Forget the forest animals....think Bull...Bull divergent on a fake poke and double bottom....that's my take anyways....she should start to the upside. A weekly close below the all time low wouldn't be healthy.
http://stockcharts.com/c-sc/sc?s=$USD&p=W&yr=4&mn=6&dy=0&i=p58059427784&a=62572955&r=3195.png
http://stockcharts.com/c-sc/sc?s=$USD&p=W&yr=4&mn=6&dy=0&i=p58059427784&a=62572955&r=3195.png
#5

Posted 14 July 2007 - 04:09 PM
Very similar setup. Subsequently QID broke down hard. Almost 10%..... USD will probably break down hard here too. Monthly chart wouldn't help. I'm actually considering the long Yen trade here. And I really like the Australian dollar ETF (FXA), it yields 5.75% too on top of a good looking chart.


Edited by ogm, 14 July 2007 - 04:10 PM.
#6

Posted 31 August 2007 - 07:37 PM
I have no idea when this will go terminal. It certainly wasn't meant to be here after all.
Lower lows have have been uncommon and shallow on this chart.


