Maybe Denleo is on to something with his post yesterday.
Also the volume was huge on this week's bar.
If the image doesnt load properly, see it here.
Edited by kaiser soze, 21 July 2007 - 03:56 PM.

Member
Posted 21 July 2007 - 03:50 PM
Edited by kaiser soze, 21 July 2007 - 03:56 PM.
Member

Posted 21 July 2007 - 04:16 PM
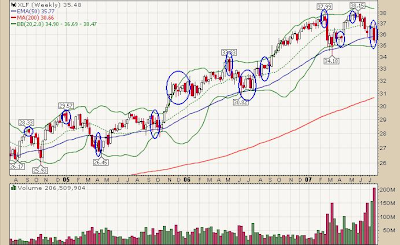
Almost every trend-change in the financials (including consolidations) over the past three years has been preceded by a range bar on the weekly chart. Consecutive range bars have usually resulted in consolidation patterns which have been resolved by guess what ? Another range bar.
Maybe Denleo is on to something with his post yesterday.
Also the volume was huge on this week's bar.
If the image doesnt load properly, see it here.
 Look at the weekly chart on many individual banks and brokers. They are NOT going up any time soon. Their business is falling apart. LBO's, IPO's, CDO's, you name it. Its all going to hell in a hand basket. Lights out on liquidity.
 Member
Posted 21 July 2007 - 04:55 PM
Member
Posted 21 July 2007 - 05:19 PM
I know the fundamentals and I agree with you, oqm.
But the tape is the tape is the tape. And like it or not, the weekly range bar has been a good tool at picking up even minor trend-changes on the XLF chart. And that last bar's humongous volume-doesn't that signal atleast a minor capitulation, a pause before more decline ?
Now if the next week's bar is another range bar, it might be a consolidation before moving lower. Or we may turn back up higher. But I think its best to keep an open mind at the present moment.
Member

Posted 22 July 2007 - 02:08 PM


