Jump to content


Photo

SP futures contract delta


  • Please log in to reply
1 reply to this topic

#1 dcengr

dcengr

    Member

  • Traders-Talk User
  • 13,391 posts

Posted 21 July 2007 - 10:30 PM

Net large trader position - net small trader position..

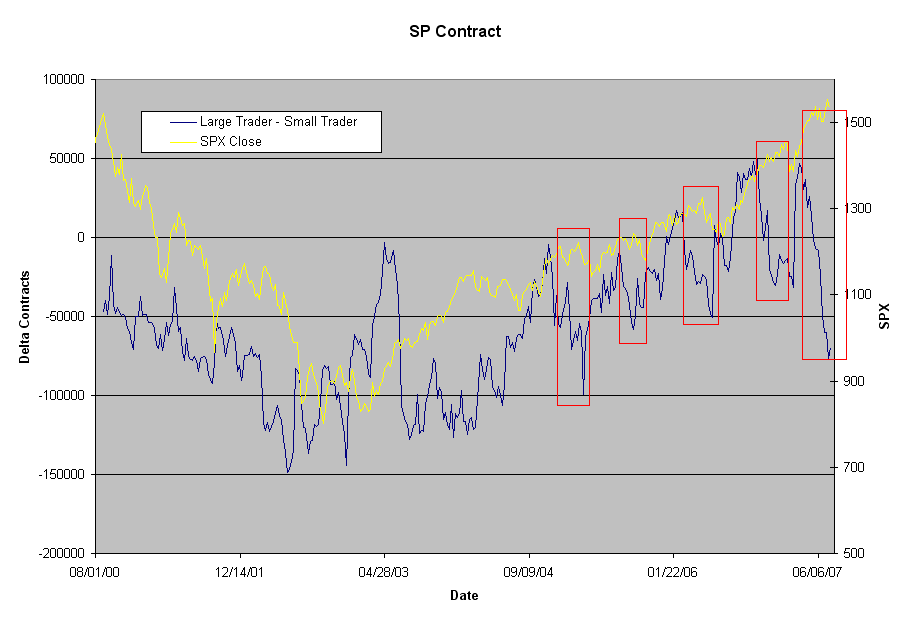
Still staring at this one.. mainly because everyone assumes commercials are the smart money. One would obviously have a very hard time trying to time when to go long or short based on this chart, but looking at it, there maybe a pattern.. the large SP traders do seem to engulf small SP traders positions before some sort of IT top, at least for the rectangles I've drawn. It would seem to be the case for some areas in early 2000, but the area in early 2003 this chart would've been woefully misleading maybe.

Also note that this chart was in a flag configuration with rising bottoms and rising tops until recently..

Posted Image
Qui custodiet ipsos custodes?

#2 traderpaul

traderpaul

    Member

  • Traders-Talk User
  • 6,034 posts

Posted 22 July 2007 - 08:29 AM

They assume that when the market was going up everyone was buying and there were no selling......The smart money were selling on the wasy up.....putting limit orders above the market......selling partial positions as the market were going up.....they dumb money were adding (double up) as the market was going up.....so a little corrrection will wipe out all their gains.....
"Inflation is taking place now. Prices may not appear to be rising because they are making packaging smaller. "— Rickoshay