
T-4 Signal
Started by
OEXCHAOS
, Jul 22 2007 01:30 PM
10 replies to this topic
#1

OEXCHAOS
-
- Admin
- 22,022 posts
Mark S. Young
Posted 22 July 2007 - 01:30 PM
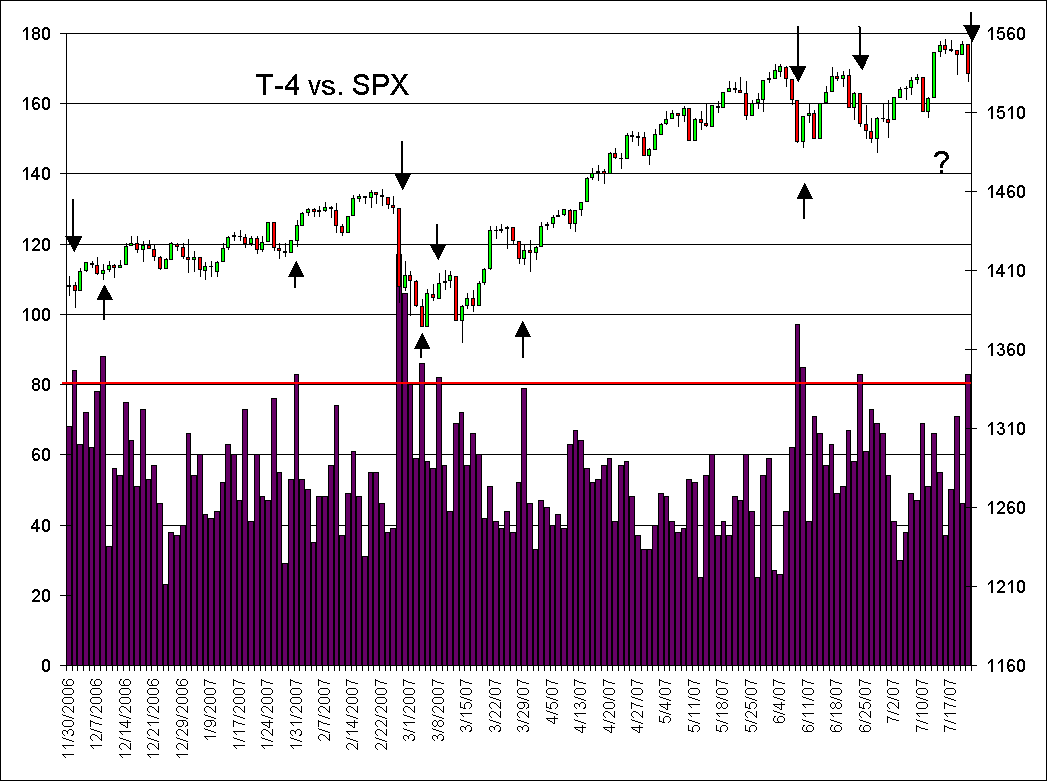
We got a signal on Friday. Given the technicals and the other sentiment, I'm thinking it was a Sell. This is not a high confidence call, however. Also, it may not be a long lasting signal. Take a look at past signals below and see what you think.
Mark S Young
Wall Street Sentiment
Get a free trial here:
http://wallstreetsen...t.com/trial.htm
You can now follow me on twitter
#2
selecto
-

- Traders-Talk User
- 6,871 posts
Member
Posted 22 July 2007 - 01:53 PM
I can't pick off the dates of the "signals" accurately with these tired eyes, but perhaps the "signal" might be in the direction of something-or-other. If you have the signal dates (text) I'll have a look see. 
#3
relax
-

- Traders-Talk User
- 2,224 posts
Member
Posted 22 July 2007 - 02:09 PM
Hi,
Well the way i see it values above 80 have most often produced bottoms, should this be the case?
and low values have reflected a top
so maybe we find a bottom monday
i can see that back in february the value of above 80 produced more move down, but back then there were also several readings above 80
so if we have a bottom on monday then it should be followed by readings below 80
Are you also seeing it that way?
Can you post this chart the next days - will be interesting to see ;-
#4
Jnavin
-

- TT Member*
-

- 2,126 posts
Member
Posted 22 July 2007 - 02:11 PM
I vote for "bottom Monday" and then higher highs and then some real selling.
#5
OEXCHAOS
-
- Admin
- 22,022 posts
Mark S. Young
Posted 22 July 2007 - 04:57 PM
Check your email, Mike.
Mark
Mark S Young
Wall Street Sentiment
Get a free trial here:
http://wallstreetsen...t.com/trial.htm
You can now follow me on twitter
#6
selecto
-
- Traders-Talk User
- 6,871 posts
Member
Posted 22 July 2007 - 05:06 PM
Thanks. Mark. Ok, I looked at a bunch of stuff, but am only posting the clearest. Looks to me like the trade wants to be taken in the direction of the slope of the Macd histogram. ('cept when it doesn't  )
)

)
#7
OEXCHAOS
-
- Admin
- 22,022 posts
Mark S. Young
Posted 22 July 2007 - 05:12 PM
I think lots of signals suggest increased volatility and likely a turn, too.
I need to check the data again, too. There's one signal day in there which I think is an anomaly due to some work we were doing on the site. I'll let you know if I had corrected that already.
Mark
Mark S Young
Wall Street Sentiment
Get a free trial here:
http://wallstreetsen...t.com/trial.htm
You can now follow me on twitter
#8
arbman
-

- Traders-Talk User
- 19,504 posts
Quant
Posted 22 July 2007 - 06:58 PM
As I said, a strong bounce and then a sell off, a low later in July and higher into August and then BAMM into Sep! 

- kisa
- kisa
#9
arbman
-
- Traders-Talk User
- 19,504 posts
Quant
Posted 22 July 2007 - 07:43 PM
The futures are looking pretty weak, but if the damage stays around here, it can still rally after the open. One factor though, the speculation was getting absurd late last week, this was not quite the case for March 2006, so without much bearish support, any upside should be very ST or even intraday...
#10
vitaminm
-

- Traders-Talk User
- 6,701 posts
Member
Posted 22 July 2007 - 09:11 PM
spx
5-15-60min -daily sell...........S@1490
near term R@1550
vitaminm


