Someone bought all last week...
AAII Data Bull Neutral Bear Bull% 4MA
10/11/06 48.98 13.27 37.76 56.47%
10/18/06 54.20 16.03 29.77 64.55%
10/25/06 52.17 17.39 30.43 63.16%
11/02/06 43.75 19.38 36.88 54.26% 59.61%
11/08/06 50.60 22.89 26.51 65.62% 61.90%
11/15/06 46.56 22.90 30.53 60.40% 60.86%
11/22/06 41.94 16.13 41.94 50.00% 57.57%
11/29/06 40.22 12.29 47.49 45.86% 55.47%
12/06/06 38.94 19.47 41.59 48.35% 51.15%
12/14/06 41.33 20.67 38.00 52.10% 49.08%
12/20/06 39.08 18.39 42.53 47.89% 48.55%
12/27/06 46.00 18.00 36.00 56.10% 51.11%
01/03/07 49.14 21.55 29.31 62.64% 54.68%
01/10/07 44.44 21.30 34.26 56.47% 55.77%
01/17/07 57.58 15.15 27.27 67.86% 60.77%
01/24/07 39.51 27.16 33.33 54.24% 60.30%
01/31/07 46.32 23.16 30.53 60.27% 59.71%
02/07/07 46.15 23.85 30.00 60.60% 60.75%
02/14/07 47.57 21.36 31.07 60.49% 58.90%
02/22/07 53.85 23.85 22.31 70.71% 63.02%
03/01/07 36.63 23.76 39.6 48.05% 59.96%
03/07/07 35.8 19.32 44.89 44.37% 55.90%
03/14/07 32.99 21.65 45.36 42.11% 51.31%
03/21/07 43.88 23.02 33.09 57.01% 47.88%
03/28/07 42.68 31.71 25.61 62.50% 51.50%
04/04/07 32.26 27.96 39.78 44.78% 51.60%
04/09/07 33.33 30 36.67 47.61% 52.98%
04/10/07 40.85 21.13 38.03 51.79% 51.67%
04/18/07 46.94 23.47 29.59 61.34% 51.38%
04/25/07 39.24 22.78 37.97 50.82% 52.89%
05/02/07 28.57 17.14 54.29 34.48% 49.61%
05/09/07 42.86 14.29 42.86 50.00% 49.16%
05/16/07 38.39 25 36.61 51.19% 46.62%
05/23/07 37.35 24.1 38.55 49.21% 46.22%
05/30/07 33.33 21.88 44.79 42.67% 48.27%
06/06/07 40.59 16.83 42.57 48.81% 47.97%
06/13/07 37.3 19.05 43.65 46.08% 46.69%
06/20/07 43.16 23.16 33.68 56.17% 48.43%
06/27/07 39.02 25.2 35.77 52.17% 50.81%
07/05/07 43.84 23.29 32.88 57.14% 52.89%
07/11/07 43.64 26.36 30 59.26% 56.19%
07/18/07 41.77 21.52 36.71 53.22% 55.45%
07/25/07 44 18.95 36.84 54.43% 56.01%
08/01/07 45.88 14.12 40 53.42% 55.08%
08/08/07 45.76 15.25 38.98 54.00% 53.77%

AAII data...
Started by
dcengr
, Aug 09 2007 09:15 PM
5 replies to this topic
#1

dcengr
-
- Traders-Talk User
- 13,391 posts
Member
Posted 09 August 2007 - 09:15 PM
Qui custodiet ipsos custodes?
#2
ogm
-

- Traders-Talk User
- 13,780 posts
Member
Posted 09 August 2007 - 10:17 PM
Here is another view. Looks to me like we're in one of the periods of overall excessive bearishness. 1-2 week data notwithstanding.
After the crash of 1987 and the bottom of 2002.. even then those bulges weren't as big as now.

After the crash of 1987 and the bottom of 2002.. even then those bulges weren't as big as now.
Edited by ogm, 09 August 2007 - 10:18 PM.
#3
dcengr
-
- Traders-Talk User
- 13,391 posts
Member
Posted 09 August 2007 - 10:36 PM
Not worried about LT, just looking at it short term.
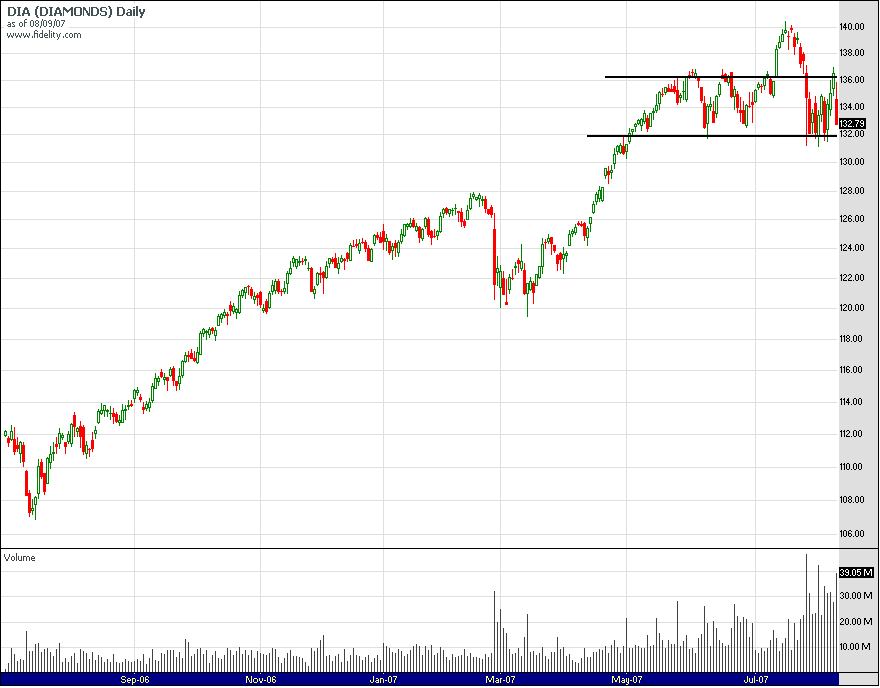
The AAII polls have been over 40% bullish the last 3 weeks with the amount of volatility its seen. Perhaps its because even with all this volatility, the Dow has been in a trading range between 13,200 and 14,000 for the past few months.
Ofcourse the RUT, SPX, and a few other indices have been taking a beating, but it hasn't been too bad there either. Either people are not worried because they're sitting on fat gains, or its complacency.
I think your average person isn't following the market, and just watching their fund statement month to month. Its not changing much so they're not concerned.
Here is another view. Looks to me like we're in one of the periods of overall excessive bearishness. 1-2 week data notwithstanding.
After the crash of 1987 and the bottom of 2002.. even then those bulges weren't as big as now.
Qui custodiet ipsos custodes?
#4
ogm
-
- Traders-Talk User
- 13,780 posts
Member
Posted 09 August 2007 - 10:42 PM
I think the average person is not even in the market. They are not in hedgefunds and they don't care. Its the high net worth guys who are stuck in hedgefunds.
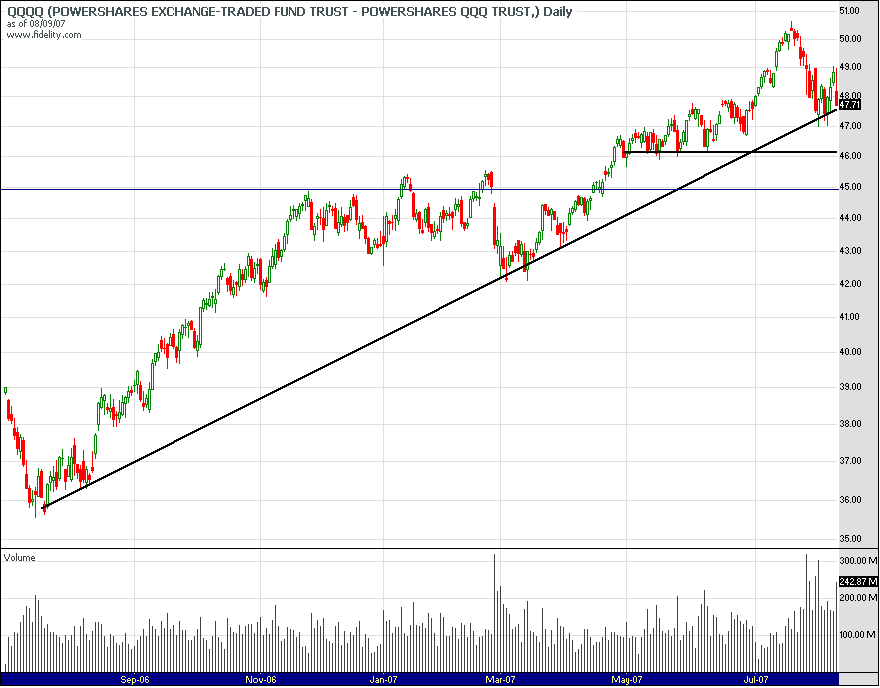
Little guy is mostly reduced to 401k statements and a couple mutual funds and ETFs in their account. Probably QQQQ, SMH and OIH and maybe a couple gold stocks.
Edited by ogm, 09 August 2007 - 10:43 PM.
#5
dcengr
-
- Traders-Talk User
- 13,391 posts
Member
Posted 09 August 2007 - 10:54 PM
I think the average person is not even in the market. They are not in hedgefunds and they don't care. Its the high net worth guys who are stuck in hedgefunds.
Little guy is mostly reduced to 401k statements and a couple mutual funds and ETFs in their account. Probably QQQQ, SMH and OIH and maybe a couple gold stocks.
Everyone's got some stock in mutual funds or 401k etc..
These charts say people are sitting on fat gains, and they're not worried. Been looking at Rasmussen polls, and its barely budged and near pretty high levels.
Qui custodiet ipsos custodes?
#6
Douglas
-

- Traders-Talk User
- 1,838 posts
Member
Posted 09 August 2007 - 11:24 PM
I've been tracking AAII sentiment for years. These guys flip postion at the drop of a hat. The fact that they haven't shifted to net bearish is bearish short term in my way of looking at it.


