11/2/07 $BKX support at 95 +/- which is 10yr LT support with 38 +/- fib RT, however, it will likely find LT support near 83 +/- Jan 2003 H. This is 61.8% fib RT of Oct2002-Feb2007 rally and 38.20% fib RT of entire rally from 1995.
For EW case for the above, it is completion of "A" of corrective A-B-C .
This would be the same scenario as it was in 1998.
Trade well
http://stockcharts.com/c-sc/sc?s=$BKX&p=D&yr=6&mn=6&dy=0&i=p28950028607&a=120071237&r=559.png
http://stockcharts.com/c-sc/sc?s=$BKX&p=M&st=1993-11-03&i=p68866624201&a=121335312&r=326.png
The $BKX target 83 +/- is based on other technical analysis which I considered other than stated above.

$BKX targeting 83 +/-
Started by
Trend-Signals
, Nov 03 2007 09:59 AM
7 replies to this topic
#1

Trend-Signals
-
- Traders-Talk User
- 1,136 posts
Member
#2
Trend-Signals
-
- Traders-Talk User
- 1,136 posts
Member
Posted 03 November 2007 - 01:14 PM
This is an interesting comment which is basically what I was thinking as he detailed a bit.
I think that $BKX will take a bit longer to find a bottom as it did in 1998 as noted above.
http://www.traders-t...showtopic=78587
I think that $BKX will take a bit longer to find a bottom as it did in 1998 as noted above.
http://www.traders-t...showtopic=78587
#3
dcengr
-

- Traders-Talk User
- 13,391 posts
Member
Posted 03 November 2007 - 01:51 PM
My "guess" is that a rally in the buck is somehow very bullish for banks and you can't get any more worse in sentiment on banks at the moment.. plus all the news coming out.
Even if there isn't a LT bottom for banks yet, I do think we have a ST bottom where the short covering will be massive and violent for those holding onto financial shorts..
All FWIW ofcourse.
Qui custodiet ipsos custodes?
#4
Trend-Signals
-
- Traders-Talk User
- 1,136 posts
Member
Posted 03 November 2007 - 02:16 PM
Maybe, could be....
It is a bit odd ... on subprime news, the news is used like scaring market.
The hyped news, as far as I am concerned, is publicized now even though I think that the think tank is already knew about the problem as I also repeated commented on the subject during Jan-Mar 2006 that we will see subprime melt down.
It is just a matter of when the news is publicized, but then, I guess that the news can't be news until the mess is done. Having said that, those who are in financial markets should have known and should have prepared for the disaster. Nevertheless, if we can do all what we need to do, that would be unreal.
So, with the current sentiment on $BKX sector, what would cause $BKX rally, based on $USD technical bounce?
Well, maybe since $USD and $BKX closed at supports, meaning it could be negative other sectors such as tech. Seasonally tech is favorable going into EOY even though those look to be rallied in parabolic due to AAPL, GOOG, RIMM, AMZN, MSFT, etc., but most of other tech are oversold.
Will see.
#5
dcengr
-
- Traders-Talk User
- 13,391 posts
Member
Posted 03 November 2007 - 02:46 PM
I agree that technically, it appears many techs are oversold. But I think there's a difference between oversold and whats happening in the NDX.
Every time a tech stock gets chopped off at the knee caps, AAPL or GOOG goes up. This is a crowding technique I mentioned before. The strong gets stronger as people move money out of the hot fast stocks that keeled over into the ones that are still standing.
You can see the NDX AD cumulative continuing to go down while the vol cumulative continuing to climb. Which basically says that people are concentrating in less and less stocks. Soon everyone will be in the 3-4 Nasdaq stocks. Once everyone who ever wanted to buy AAPL or GOOG or RIMM are in.. then they start to go down. And since theres less and less strong stocks to put money into, they put it in something else or just hold their losses. Then in the end, it collapses under its own weight ofcourse.
Thats why I'm highly interested in when parabolics die off, because that will tell when the NDX croaks. I've been comparing AAPL fractals in time to see if I can spot patterns. This chart, for instance compares AAPL price pattern to its 2000 parabolic run. The x and y are scaled, therefore you can make it match a lot of things, ofcourse, but thats why I need to sharpen my pencil and see if I can spot the exact moment when parabolics die. Its got to be news based, I think, and if GOOG announces an iPhone competitor monday, that could be a catalyst.. I'm not sure. But every chartist can see that this is parabolic.. where the music stops is anyone's guess.
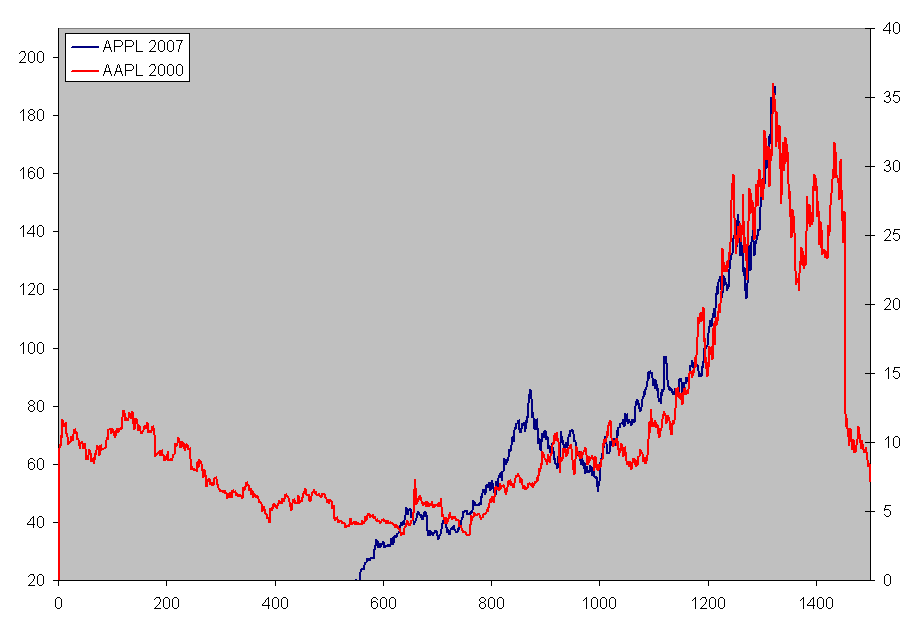
Qui custodiet ipsos custodes?
#6
Trend-Signals
-
- Traders-Talk User
- 1,136 posts
Member
Posted 03 November 2007 - 02:59 PM
Agree with your comment that we have narrow breadth, since selectivity started in 2004. I also commented on the subject before. We now have selective few big cap stocks carrying NDX.
However, as noted below, the initial breadth will carry forward daily price actions as we had 8/16 intermediate breadth low. As noted on 10/11 correction, I was looking for a correction since daily price action was overbought.
As we can see, price actions often show divergences from breadth for a while, i.e. breadth is declining, price is climbing.
Again, it seems that many traders are looking for 11/2-12/20 period as declining period which I commented that 11/2 as pivotal day as I was thinking that it would be a continuation of the recent uptrend.
Will see....
http://www.stockcharts.com/c-sc/sc?s=$NASI&p=D&yr=2&mn=0&dy=0&i=p11991482645&a=78149576&r=739.png
http://investorshub....xt2find=breadth
http://www.stockcharts.com/c-sc/sc?s=$SPXA200&p=D&st=2007-01-01&i=p67229922524&a=96227204&r=831.png
#7
dcengr
-
- Traders-Talk User
- 13,391 posts
Member
Posted 03 November 2007 - 03:13 PM
There's a big difference in the chart you're posting and the NDX.
While the overall nasdaq breadth was decreasing, and it has been for a long time now, the NDX and IXIC continued to move upward.
HOWEVER, if you look at the breadth of NDX components ONLY, you will note that it has been properly increasing with price. And you will also note that when breadth of NDX components diverged with NDX, it did signal a correction some time later. We are currently at a divergent state, although I can never tell where price kicks over when it diverges from breath for a long time.. at least for NDX.
This chart should illustrate somewhat the breadth divergence in NDX stocks only..
http://stockcharts.com/c-sc/sc?s=$NDX:$NDXE&p=D&yr=1&mn=6&dy=0&i=p89810424917&a=95567156&r=42.png
Qui custodiet ipsos custodes?
#8
Trend-Signals
-
- Traders-Talk User
- 1,136 posts
Member
Posted 03 November 2007 - 04:06 PM
NDX price performances are driven by a few big caps.
You are a bear so your presentation is biased as I am, so we will see.
This is NDX components sorted by 52 week H
-52wH +52wL Symbol Close change % chg Stock 52wk H 52w L Volume
1.58% 152.82% MICC(F) 121.15 5.12 4.45% Millicom Intl Cellular S.A. 119.27 47.92 1,177,479
0.82% 140.77% APOL 80.25 0.91 1.15% Apollo Group'A' 79.60 33.33 2,744,132
0.26% 65.17% CTXS 43.11 0.48 1.13% Citrix Systems 43.00 26.10 2,347,508
0.09% 51.52% GILD 46.91 1.10 2.40% Gilead Sciences 46.87 30.96 9,430,632
-0.35% 62.76% GOOG 711.25 8.10 1.15% Google Inc Cl A 713.72 437.00 5,842,237
-0.38% 41.99% CKFR 47.48 0.09 0.19% Checkfree Corp 47.66 33.44 909,380
-0.85% 38.25% SIAL 51.36 0.77 1.52% Sigma-Aldrich 51.80 37.15 791,593
-0.91% 119.91% ESRX 65.05 0.85 1.33% Express Scripts 65.65 29.58 4,308,848
-1.03% 42.93% INTC 26.80 0.32 1.21% Intel Corp 27.08 18.75 58,633,742
-1.10% 231.55% RIMM 126.95 5.04 4.13% Research In Motion 128.36 38.29 21,077,711
-1.15% 38.75% MSFT 37.06 (0.02) -0.05% Microsoft Corp 37.49 26.71 96,399,108
-1.18% 144.72% AAPL 187.87 0.36 0.19% Apple Inc 190.12 76.77 35,790,328
-1.22% 28.71% ADBE 47.88 0.74 1.58% Adobe Systems 48.47 37.20 6,579,441
-1.55% 24.44% PDCO 39.46 0.10 0.24% Patterson Companies 40.08 31.71 527,122
-1.55% 46.64% RYAAY 48.95 1.20 2.51% Ryanair Holdings ADS 49.72 33.38 485,957
-1.68% 15.60% FLEX 12.30 0.26 2.18% Flextronics Intl 12.51 10.64 10,508,429
-1.88% 30.67% ERTS 60.46 1.77 3.01% Electronic Arts 61.62 46.27 6,494,340
-2.18% 63.39% LOGI 36.42 1.00 2.82% Logitech Intl ADR 37.23 22.29 1,487,629
-2.34% 39.06% DELL 30.05 0.41 1.38% Dell Inc 30.77 21.61 24,727,221
-2.83% 27.27% GENZ 74.72 0.48 0.66% Genzyme Corporation 76.90 58.71 2,641,967
-2.84% 45.27% TEVA 44.06 0.39 0.89% Teva Pharm Indus ADR 45.35 30.33 5,759,434
-3.23% 51.70% XRAY 44.66 0.25 0.57% Dentsply Intl 46.15 29.44 1,141,720
-3.24% 37.99% CSCO 32.51 0.57 1.77% Cisco Systems 33.60 23.56 53,254,530
-3.96% 48.04% ATVI 23.05 0.39 1.69% Activision Inc 24.00 15.57 6,338,039
-4.22% 37.95% ORCL 22.03 0.22 1.01% Oracle Corp 23.00 15.97 30,857,067
-4.89% 43.10% ADSK 48.81 0.69 1.44% Autodesk, Inc 51.32 34.11 1,671,482
-5.81% 231.38% FWLT 146.67 1.45 1.00% Foster Wheeler Ltd 155.72 44.26 944,620
-5.90% 92.65% DISCA 28.05 0.27 0.97% Discovery Holding Co Series A 29.81 14.56 1,836,976
-6.77% 111.22% JNPR 35.38 0.59 1.70% Juniper Networks 37.95 16.75 10,304,579
-7.01% 32.18% EXPD 50.64 1.74 3.56% Expeditors Intl of Washington 54.46 38.31 1,389,366
-7.04% 27.59% COST 65.58 0.74 1.14% Costco Wholesale 70.55 51.40 6,153,838
-7.34% 25.59% FISV 55.46 0.50 0.92% Fiserv Inc 59.85 44.16 1,383,940
-7.35% 21.79% CHKP 24.82 (0.05) -0.21% Check Point Software Tech 26.79 20.38 1,142,129
-7.39% 96.58% NVDA 36.74 1.24 3.50% Nvidia Corp 39.67 18.69 12,299,242
-7.79% 24.48% INTU 32.54 0.71 2.23% Intuit Inc 35.29 26.14 2,619,574
-8.19% 261.72% ISRG 311.80 (12.02) -3.73% Intuitive Surgical 339.63 86.20 1,661,404
-8.47% 54.97% VRSN 32.42 0.16 0.50% Verisign Inc 35.42 20.92 7,989,955
-8.71% 39.69% YHOO 31.11 1.28 4.24% Yahoo Inc 34.08 22.27 34,091,755
-8.84% 35.86% WFMI 48.91 1.21 2.55% Whole Foods Market 53.65 36.00 3,398,526
-8.92% 39.09% DISH 47.50 (1.17) -2.41% EchoStar Communications'A' 52.15 34.15 2,106,055
-9.89% 57.05% LBTYA 40.55 0.80 2.01% Liberty Global Inc Cl A 45.00 25.82 2,167,969
-9.92% 96.29% EXPE(F) 31.78 (0.69) -2.13% Expedia Inc 35.28 16.19 2,966,514
-10.40% 61.62% BEAS(E) 16.97 0.22 1.31% Bea Systems 18.94 10.50 10,141,122
-11.76% 43.99% UAUA 45.53 (1.61) -3.42% UAL Corp 51.60 31.62 2,442,982
-12.66% 14.11% PAYX 41.17 0.62 1.53% Paychex Inc 47.14 36.08 2,053,391
-12.70% 52.68% JOYG 57.18 1.18 2.11% Joy Global 65.50 37.45 3,131,652
-12.71% 72.61% BIIB 73.98 0.81 1.12% Biogen Idec 84.75 42.86 3,014,298
-13.37% 20.35% QCOM 41.34 0.05 0.12% Qualcomm Inc 47.72 34.35 14,702,816
-13.92% 31.30% CELG 64.94 0.51 0.79% Celgene Corp 75.44 49.46 4,500,202
-14.02% 22.45% EBAY 35.02 0.02 0.06% Ebay Inc 40.73 28.60 26,063,986
-14.32% 12.42% CEPH 72.68 (0.03) -0.05% Cephalon Inc 84.83 64.65 886,581
-14.33% 19.93% MRVL 18.29 0.11 0.61% Marvell Technology Group 21.35 15.25 9,248,874
-14.40% 21.01% CTSH 40.90 1.80 4.54% Cognizant Tech Solutions'A' 47.78 33.80 2,843,403
-14.95% 136.86% AMZN 85.98 (1.67) -1.91% Amazon.com Inc 101.09 36.30 10,231,033
-15.18% 106.21% WYNN 149.40 (5.59) -3.61% Wynn Resorts 176.14 72.45 3,435,202
-15.48% 14.26% SYMC 18.51 0.02 0.11% Symantec Corp 21.90 16.20 16,637,991
-15.94% 9.86% LLTC 32.65 0.13 0.40% Linear Technology Corp 38.84 29.72 3,688,247
-16.30% 46.51% PCAR 55.03 0.76 1.42% Paccar Inc 65.75 37.56 2,060,190
-17.11% 32.77% FAST 43.88 1.10 2.57% Fastenal Co 52.94 33.05 867,083
-17.36% 15.05% INFY 50.62 0.70 1.40% Infosys Technologies ADS 61.25 44.00 2,117,737
-17.40% 24.44% JAVA 5.60 0.14 2.56% Sun Microsystems Inc 6.78 4.50 71,470,407
-17.73% 20.34% LINTA 21.30 0.17 0.81% Liberty Media Hldg Inter Ser A 25.89 17.70 2,536,331
-17.96% 11.79% AMAT 18.87 0.12 0.64% Applied Materials 23.00 16.88 22,203,570
-18.47% 20.28% CHRW 47.44 0.02 0.05% C.H. Robinson Worldwide Inc 58.19 39.44 1,995,342
-18.71% 2.68% CTAS 35.63 0.09 0.25% Cintas Corp 43.83 34.70 1,083,976
-18.76% 8.83% KLAC 50.91 0.09 0.18% KLA-Tencor Corp 62.67 46.78 2,828,918
-18.97% 21.38% AMLN 43.15 (0.70) -1.61% Amylin Pharmaceuticals 53.25 35.55 2,846,594
-19.59% 3.48% PETM 28.53 (0.69) -2.37% Petsmart Inc 35.48 27.57 1,758,388
-20.01% 12.88% LRCX(E) 48.65 (0.19) -0.39% Lam Research 60.82 43.10 1,898,520
-20.92% 6.35% XLNX 24.12 (0.11) -0.45% Xilinx Inc 30.50 22.68 6,698,051
-21.67% 115.17% GRMN 98.44 (1.81) -1.81% Garmin Ltd 125.68 45.75 7,071,580
-21.79% 4.09% SPLS 21.90 (0.33) -1.48% Staples Inc 28.00 21.04 6,823,896
-22.63% 11.02% LAMR 52.57 0.08 0.15% Lamar Advertising 'A' 67.95 47.35 726,306
-23.06% 10.04% MCHP 32.67 0.24 0.74% Microchip Technology 42.46 29.69 1,776,266
-24.14% 12.44% BRCM 32.62 0.31 0.95% Broadcom Corp'A' 43.00 29.01 9,290,610
-24.79% 1.56% BBBY 32.58 (0.27) -0.82% Bed Bath & Beyond 43.32 32.08 3,476,860
-24.83% -0.56% MXIM(H) 26.55 (0.56) -2.07% Maxim Integrated Prod 35.32 26.70 5,727,095
-24.94% 23.31% SIRI 3.28 0.17 5.45% Sirius Satellite Radio 4.37 2.66 59,691,273
-25.64% 24.04% SNDK 44.43 0.22 0.49% SanDisk Corp 59.75 35.82 7,369,918
-25.70% 6.20% CDNS 18.50 (0.53) -2.81% Cadence Design Systems 24.90 17.42 9,126,693
-25.88% 26.52% XMSR 13.12 0.80 6.43% XM Satellite Radio'A' 17.70 10.37 6,728,472
-26.18% 10.62% ALTR 19.37 0.09 0.47% Altera Corp 26.24 17.51 5,766,684
-26.27% 8.45% PTEN 20.80 0.74 3.69% Patterson-UTI Energy 28.21 19.18 5,193,954
-26.42% 17.23% AMGN 56.62 (0.62) -1.08% Amgen Inc 76.95 48.30 13,717,981
-26.59% 1.73% ROST 25.82 0.21 0.82% Ross Stores 35.17 25.38 1,752,685
-27.48% 33.90% NTAP 30.14 (0.71) -2.30% Network Appliance 41.56 22.51 11,538,275
-27.74% 18.10% IACI 29.62 (0.20) -0.67% IAC/InterActiveCorp New 40.99 25.08 2,609,597
-29.06% 20.08% MNST 38.87 (0.03) -0.08% Monster Worldwide 54.79 32.37 2,503,680
-29.37% -1.67% VMED 21.19 (0.60) -2.75% Virgin Media Inc 30.00 21.55 3,580,436
-31.91% -0.19% CMCSA 20.55 (0.05) -0.24% Comcast Cl'A' 30.18 20.59 39,361,443
-32.25% 4.22% ERIC 29.41 0.53 1.84% Ericsson(LM)tel'B'ADS 43.41 28.22 3,044,501
-32.29% 7.11% SHLD 132.16 0.62 0.47% Sears Holding Corporation 195.18 123.39 3,229,510
-35.30% 39.17% AKAM 38.62 0.62 1.63% Akamai Technologies 59.69 27.75 4,192,610
-35.90% 10.40% NIHD 57.97 1.61 2.81% NII Holdings 90.43 52.51 3,441,041
-36.19% 1.23% SBUX 25.53 (0.38) -1.47% Starbucks Corp 40.01 25.22 14,312,423
-36.32% 12.85% VRTX 28.90 (2.74) -8.66% Vertex Pharmaceuticals 45.38 25.61 9,227,730
-38.55% -0.59% TLAB 8.40 (0.12) -1.41% Tellabs, Inc 13.67 8.45 9,390,399
-55.00% 5.52% LVLT 3.06 0.14 4.78% Level 3 Communications 6.80 2.90 32,560,466
-59.03% 16.45% SEPR 25.91 (1.34) -4.92% Sepracor Inc 63.24 22.25 8,914,027


