I apologize for being a bit lazy, maybe busy too.
With dividends paid being so low (thanks to tax law) there seems to be little difference on the recent decade.
It seems like there should be an easy answer. But it doesn't be enough of a concern to make it readily obtainable.
Here's what a search offered:
1950 to 2010:
Total Return
According to Standard & Poor's, the dividend component was responsible for 44 % of the total return of the last 80 years of the index. If we are to analyze the historical profitability of stock investments, this portion cannot be neglected. Therefore, it is of interest to graph and average the total return (meaning the increase in value if all dividends were reinvested) instead of the evolution of price. The following graph shows the S&P 500 historical return since 1950:
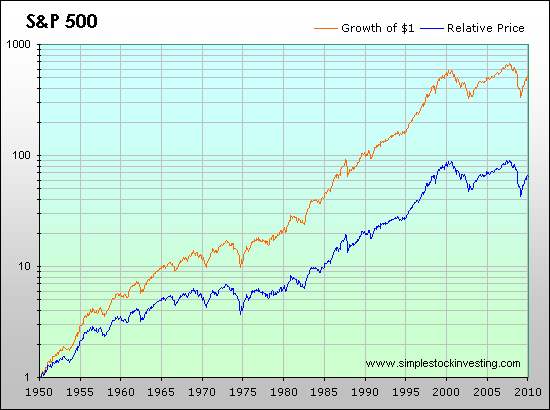
The effect of investing $1 in 1950 is seen. The orange curve shows the result of having all dividends reinvested (i.e., the total return), while the blue curve disregards dividends, therefore reflecting only the evolution of price. As can be seen, reinvesting all dividends produced about 8 times the return. Note that the y-axis is logarithmically scaled, for better appreciation of the earlier trends.
http://www.simplesto...tal-returns.htm
http://tal.marketgau...sp?chart=DIVTBL

Edited by Rogerdodger, 26 June 2011 - 04:52 PM.


