in ST bounce territory
https://www.mcoscill...t_breadth_data/

Member
Member
Posted 31 January 2021 - 12:53 PM
Member
Posted 31 January 2021 - 01:03 PM
Member
Posted 31 January 2021 - 04:15 PM
https://stockcharts....bottom-153.html
I believe the VIX will top somewhere in the 30-45 range that's highlighted. That suggests to me that we're very near a selling climax. The reason I believe that the VIX will stop in this range is because nearly every panicked low since the inception of the VIX has been contained below 45-50. Check out this longer-term monthly VIX chart:
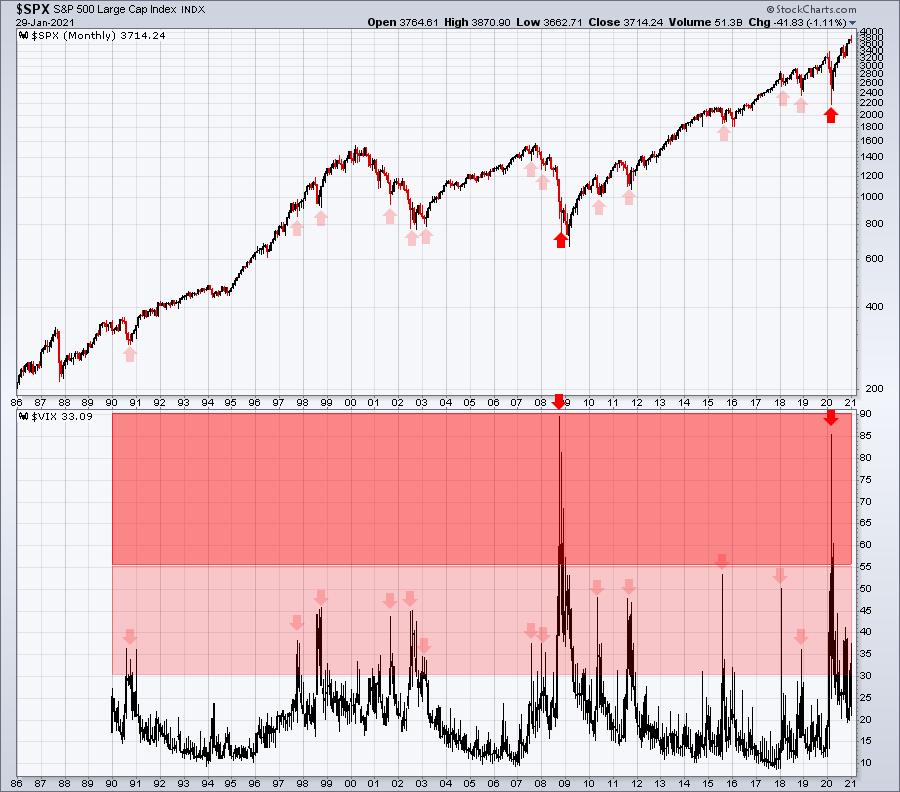
It's not easy to pinpoint EXACTLY where the VIX (and the S&P 500) will turn. However, the above long-term chart does give us a pretty good sense of where they're likely to turn. Historically, with only two exceptions, the 30-50 range is where the fear goes before it reaches a climax. In 35 years, there's only been a dozen or so instances when the VIX moves above 40. We hit 37 on Friday. We're getting close to rarified air. The only VIX trips above 50 occurred during the worst financial crisis of my lifetime (2008) and the worst health care crisis of my lifetime (2020). While we don't have a VIX reading for 1987, I suspect we would have seen a VIX top somewhere north of 50. The 1970s secular bear market likely would have produced a VIX above 50, probably in 1974.
The biggest risk of being fully invested today is being off one or two days, or maybe even a week, from a significant bottom. If we do see the VIX move into the 40s, or possibly even a test of 50, the S&P 500 could be another 10% lower. Personally, I don't believe that will happen, but it's a possibility. Snapback rallies are powerful, however, so you don't want to miss those.
https://stockcharts....bottom-153.html
Member
Posted 31 January 2021 - 04:18 PM
Stock indexes remain under pressure again today and are pressuring moving average lines. Chart 1 shows the Dow Industrials falling below its 50-day moving average for the first time since early November. It may be headed for a test of a potential support line drawn over its early September high. Chart 2 shows the S&P 500 in danger of falling below its 50-day line as well. Wednesday's message showed its daily MACD lines turning negative which warned of more selling to come. Its 14-day RSI line in the upper box has also fallen below its 50-day line which shows a weakening of momentum. It may be heading toward its early September high as well. Chart 3 shows the Nasdaq Composite Index falling below its 20-day average today. It appears headed for a test of its 50-day average (blue arrow). Its daily MACD lines have turned negative.
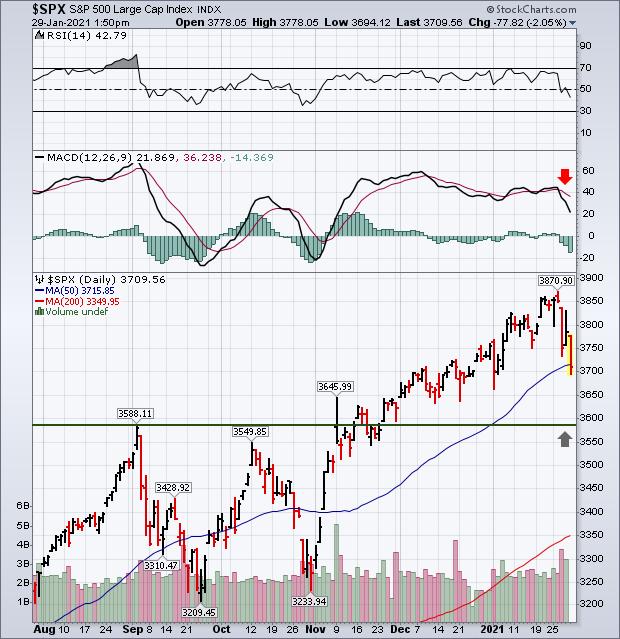 Chart 2
https://stockcharts....ntribu-379.html
Member
Posted 31 January 2021 - 04:22 PM
https://stockcharts....ash-wa-711.html
As we recorded Friday's episode of The Final Bar, it appeared that the market weakness into the closing bell could trigger further deterioration in breadth readings.
After reviewing the final breadth readings on Friday evening, I have adjusted one of my key market breadth charts from 100% bullish to 50% bullish/50% neutral. Here, we'll review why this change is a significant one, and what we're looking for to rotate to a bearish breadth reading.
Market tops often begin with bearish divergences, both from breadth indicators like the ones we've mentioned above as well as momentum indicators like RSI. In fact, one of the most telling bearish signals in February 2020 was the lower peak in the cumulative advance-decline lines as the S&P 500 continued on to higher highs.
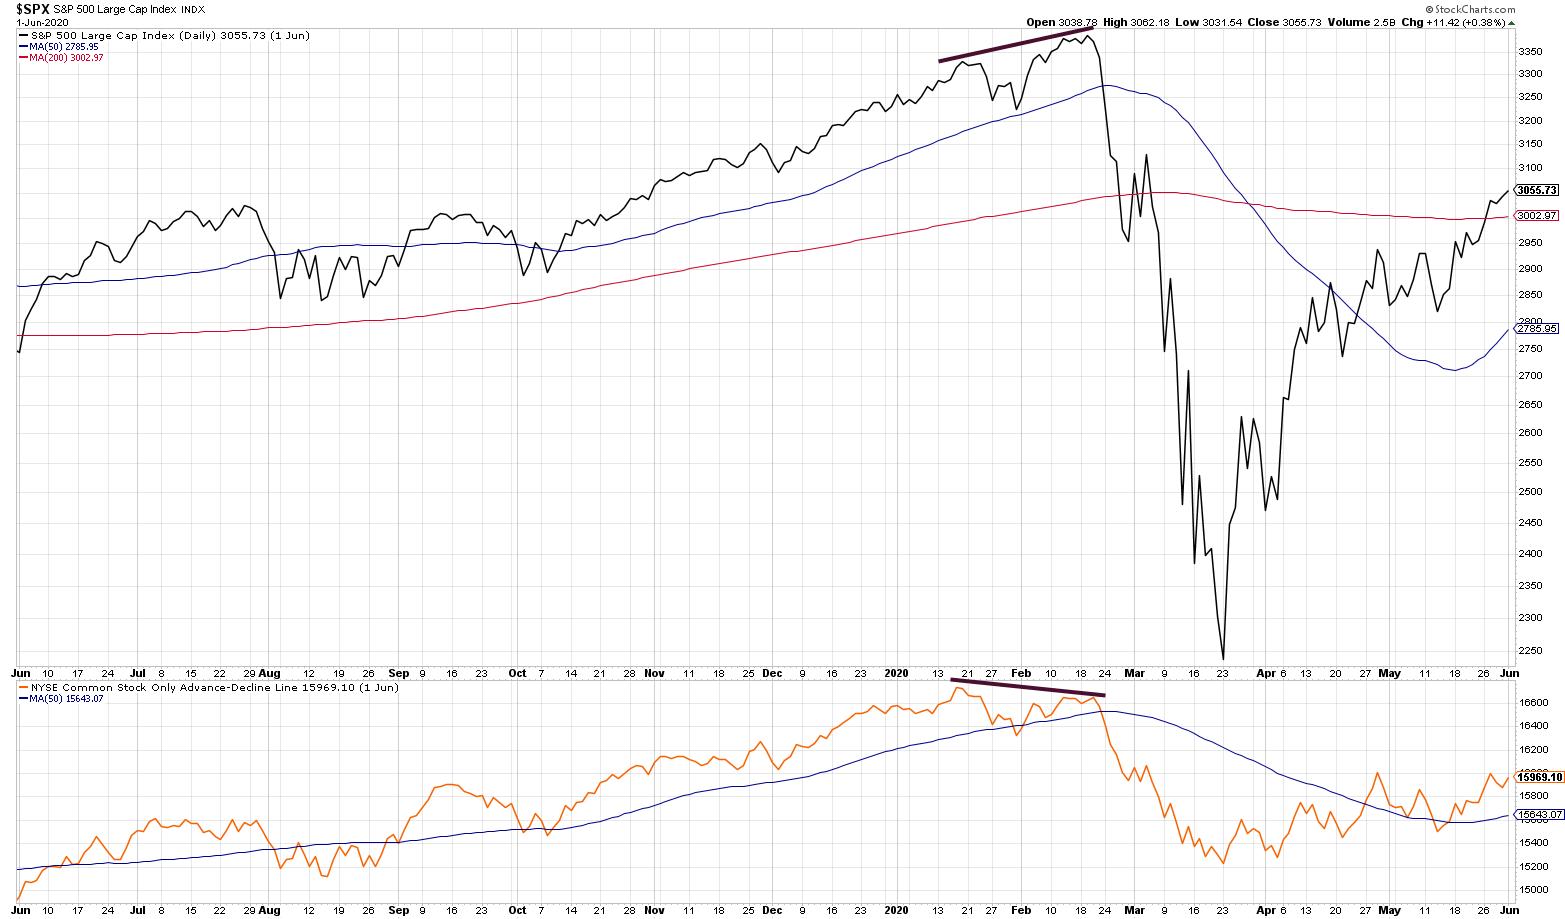
The lower peaks in the advance-decline lines were a cause for concern, but the price and breadth lines all breaking down were what finally confirmed the downtrend. This is a fantastic lesson in the value of using a mix of leading indicators (weakening breadth and momentum on higher prices) and lagging indicators (price breaks down through support).
Looking at the current breadth picture, we can see that none of the four advance-declines shown have established a lower high. All have continued to make new highs along with the S&P 500 index. So we have not seen the bearish divergence - yet.
Member
Posted 31 January 2021 - 04:26 PM
Bunch of amateurs at REDDIT? No....
"...And as we reported yesterday, the typical suspects on Wall Street – JPMorgan Chase, Goldman Sachs, Morgan Stanley and others – have been trading tens of thousands of shares of GameStop in their own Dark Pools – quasi stock exchanges that the SEC allows these firms to operate in the dark inside the bowels of their firms. In the case of JPMorgan, it has two Dark Pools, JPM-X and JPB-X, that are both trading the shares of GameStop, raising the question as to whether it’s making a two-sided market in the stock — a situation ripe for manipulation.
Then there is the old maxim that to figure out a crime scene, you look for who benefits. There were comments all over Reddit’s WallStreetBets yesterday telling others not to sell GameStop – despite the fact that the stock was up intraday as much as 82 percent at one point from its open price and up over 900 percent from its share price of three months ago. Selling pressure from the young rebels could have disadvantaged big players on Wall Street who had not yet sold their full position.
Senator Sherrod Brown, who is the incoming new Chair of the Senate Banking Committee, Tweeted yesterday that he plans to hold hearings on “the current state of the stock market.”,,,"
https://wallstreeton...lion-yesterday/
Member
Posted 31 January 2021 - 06:03 PM


