Fed Bluffs And Wall Street Calls
With the market completing a “head and shoulders” topping process and violating important support at the 38.2% Fibonacci retracement level, the next logical support is 3500. Such a correction would wipe out all the gains since the 2020 peak. Such would also push the S&P 500 index nearly 4-standard deviations below the 50-day moving average.
If the market fails to find support at 3500, 3196 becomes the next logical level.
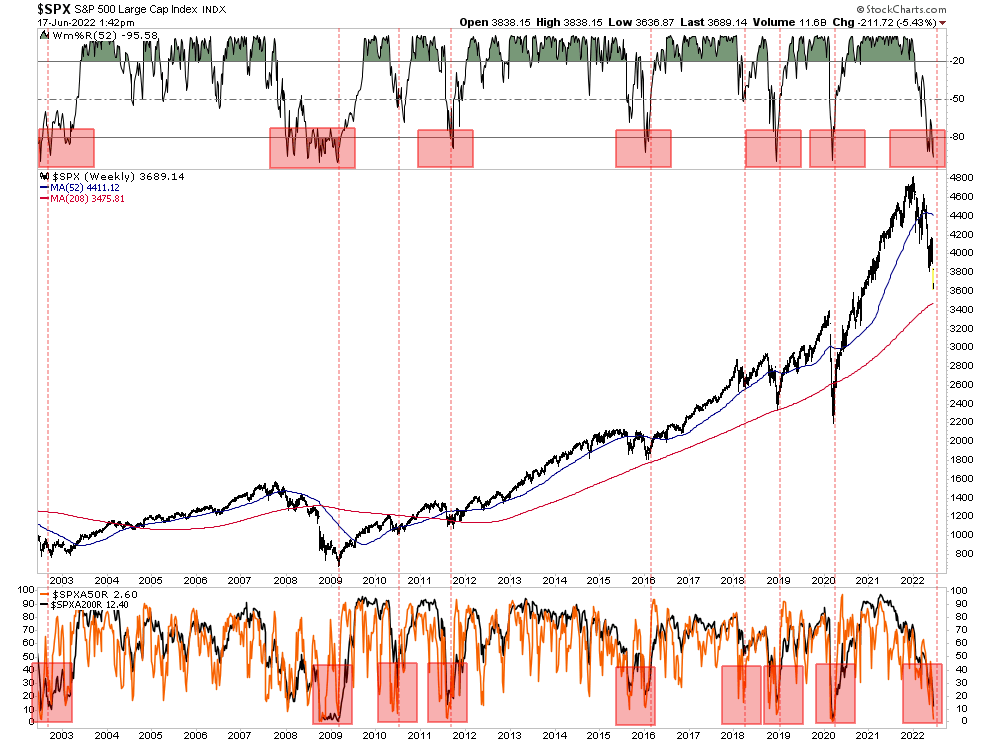
However, the market is currently showing several signals aligned with previous market bottoms. Currently, only 2.6% of stocks in the S&P 500 index are trading above their 50-day moving average. Moreover, only 12.4% are above their respective 200-dma. As shown, with the market oversold and so many stocks trading below their respective moving averages, such typically denotes market lows.

Furthermore, the market selling as of late has been brutal. As noted by BofA:
“More than 90% of stocks in the S&P 500 declined today. It’s the 5th time in the past 7 days. Since 1928, there have been exactly 0 precedents. This is the most overwhelming display of selling in history.”
While none of this data “guarantees” a market bottom is near, history suggests the odds of a reflexive rally remain elevated. We also suspect Wall Street will call the “Fed bluff” on aggressive monetary policy sooner than later.
https://realinvestme...ll-street-calls