https://stockcharts....n-progress.html
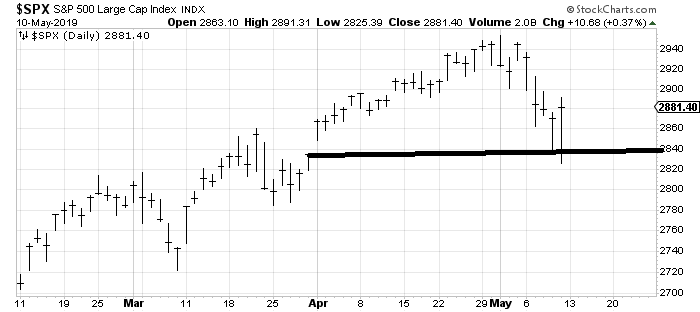
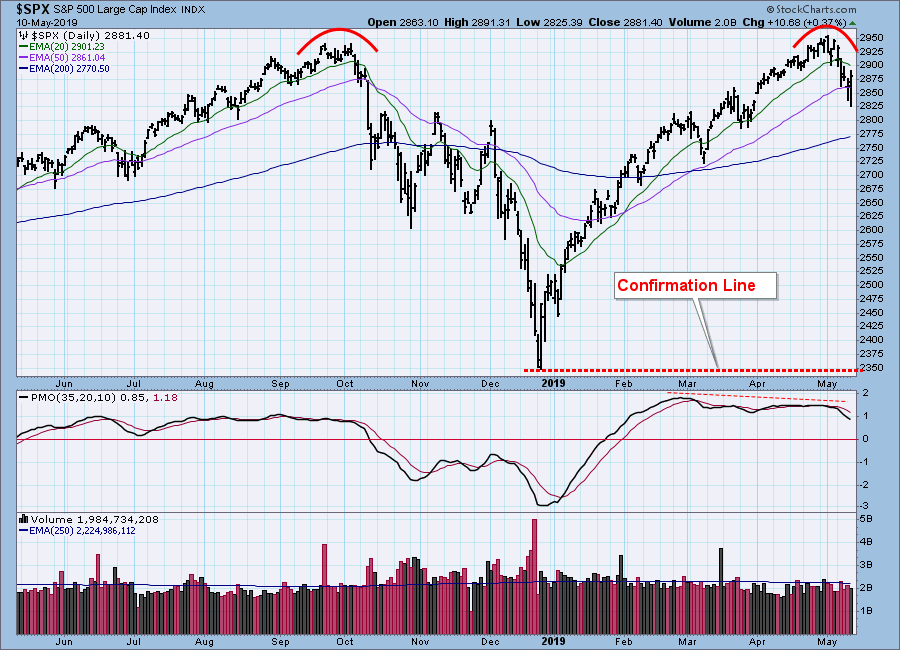
A few weeks ago, when the market began challenging the 2018 price highs, I pointed out that there was a potential for a double top. Since then, a second top has clearly formed, and the potential for more downside must be considered. The double top confirmation line is drawn across the low between the two tops, about -20% below the recent highs. If the confirmation line is violated, the double top pattern will 'execute' and infer another leg down of equal or greater magnitude, but that is way too far in the future to think about now. The potential for a continued decline from current levels is of more immediate interest.
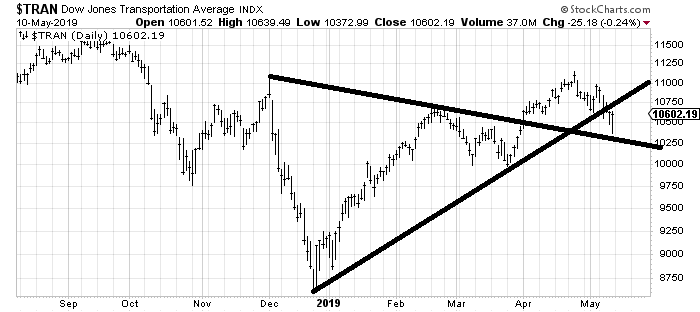
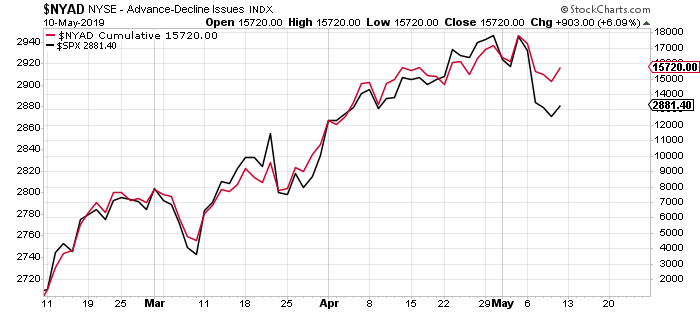
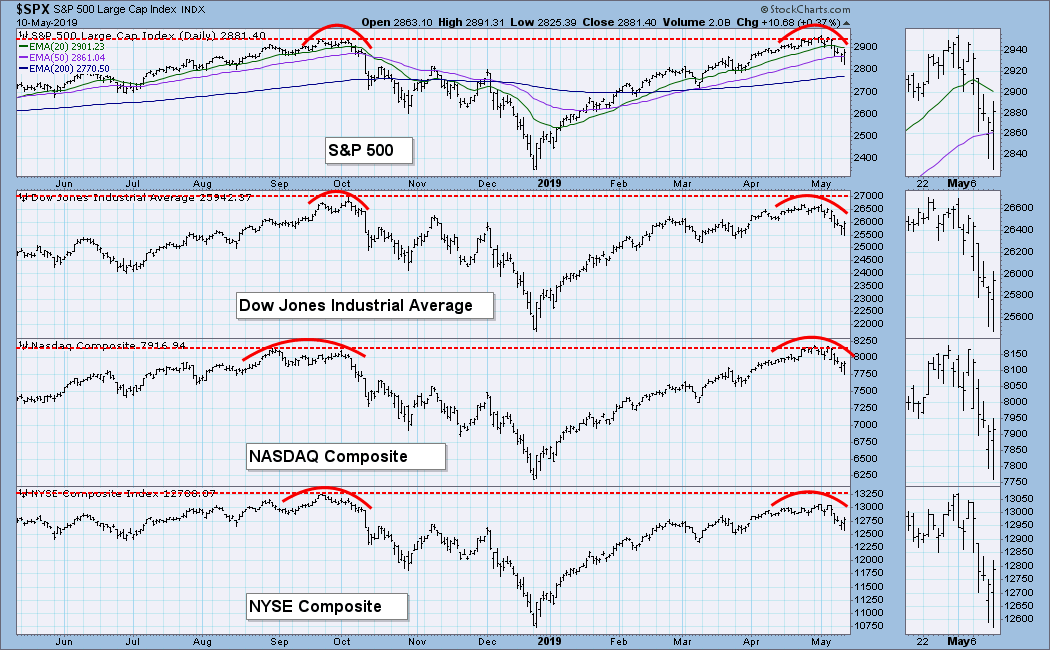
Looking at the other broad market indexes, we see a similar setup.
The DecisionPoint Weekly Wrap presents an end-of-week assessment of the trend and condition of the stock market (S&P 500), the U.S. Dollar, Gold, Crude Oil, and Bonds.