"too much tail showing" hmmm, mebbe better not go there... lmazzzoffff......
3 black crows
Started by
Chart Guru Doug
, Jan 22 2005 06:07 AM
65 replies to this topic
#51

SemiBizz
-

- Traders-Talk User
- 23,217 posts
Volume Dynamics Specialist
Posted 22 January 2005 - 11:08 PM
Price and Volume Forensics Specialist
Richard Wyckoff - "Whenever you find hope or fear warping judgment, close out your position"
Volume is the only vote that matters... the ultimate sentiment poll.
http://twitter.com/VolumeDynamics http://parler.com/Volumedynamics
Richard Wyckoff - "Whenever you find hope or fear warping judgment, close out your position"
Volume is the only vote that matters... the ultimate sentiment poll.
http://twitter.com/VolumeDynamics http://parler.com/Volumedynamics
#52
wyocowboy
-

- Traders-Talk User
- 424 posts
Member
Posted 23 January 2005 - 02:08 AM
Sentient Being has hit the nail on the head -it is about psychology of the market - or to be more specific the "sentiment ", as it is called. No pattern will ever be perfect- but some, or maybe most are "workable", you might say. If you think of the market as a psychiatric patient, you might think he was a little bit paranoid- " The sky is falling!" To be quite honest, when I am truly uncertain, I look to fundamentals - and at the present time I believe stocks are 30%-40% undervalued. I stress "present time" because interest rates are a key part of this belief. (i.e. fed model )
Good luck is with the man who doesn't include it in his plan.
- Graffitti
- Graffitti
#53
Chart Guru Doug
-
- Traders-Talk User
- 2,789 posts
Member
Posted 23 January 2005 - 07:14 AM
Fundamentals are probably the best for long term investing if you have figured a way to use them, but I doubt they are not much for shorterm trading.Sentient Being has hit the nail on the head -it is about psychology of the market - or to be more specific the "sentiment ", as it is called. No pattern will ever be perfect- but some, or maybe most are "workable", you might say. If you think of the market as a psychiatric patient, you might think he was a little bit paranoid- " The sky is falling!" To be quite honest, when I am truly uncertain, I look to fundamentals - and at the present time I believe stocks are 30%-40% undervalued. I stress "present time" because interest rates are a key part of this belief. (i.e. fed model )
To say stocks are 30/40 pecent undervalued is just way to vague. It all comes down to which stocks?
I am not your registered investment advisor. This is not a recomendation to buy or sell. This is my opinion and that is all. I may be long or short any security and change my position at any given moment in time. Do your own due diligence before investing any of your own financial assets.
#54
BearItch
-

- Traders-Talk User
- 515 posts
Member
Posted 23 January 2005 - 07:50 AM
Here was a good example from www.leavittbrothers.com for what I view the current identical three black crows for the Dow to be representing.
One question I've been meaning to ask during this great candlestick discussion, for those who have a real familiarity with how candlesticks should be read, is how do you reconcile having the irrefutable three identical black crows for the Dow (and possibly the trannies), but fail to have them the past three days for any other major index. Most major indices have three big red candles, but none come close to being the three identical black crows the Dow shows. One would think that if we are going to have a major market breakdown next week, it should be showing clearly on all major indices. The Russell 2000 for one is clearly not showing such an impending breakdown.
Your thoughts, please.
%20TJX%202.PNG)
My thoughts are that the WLSH 5000 has three crows and that is an important index and more important than the Dow for sure. I find it quite interesting that the folks here have not even mentioned it and seem to be fixated on the Dow. Well, the Wilshire 5000 is the market while the Dow is 30 stocks.
#55
Chart Guru Doug
-
- Traders-Talk User
- 2,789 posts
Member
Posted 23 January 2005 - 08:19 AM
Yes, this is similiar. Like the dji, the crows are not perfect. The last one has some tail. I think three perfect crows open at highs (previous days lows or lower) and close at low without any tail. They make a loud statement when they do that saying there is no buying interest. Our last stick has some tail saying that there is some buying interest, it also says that those interested are trapped, however if we trade above fridays highs they are no longer trapped... The last stick in itself is a statement of weakness but has less reliability where it is at and yet gains reliability where it is at because of where it is at.....Hope that makes senseMy thoughts are that the WLSH 5000 has three crows and that is an important index and more important than the Dow for sure. I find it quite interesting that the folks here have not even mentioned it and seem to be fixated on the Dow. Well, the Wilshire 5000 is the market while the Dow is 30 stocks.

In any event here is a picture of the dwc chart first picture posted here on 1/6. Did candle stick charting predict a bounce and could that have been programmed?
here is current chart...
cheers....
Attached Thumbnails
I am not your registered investment advisor. This is not a recomendation to buy or sell. This is my opinion and that is all. I may be long or short any security and change my position at any given moment in time. Do your own due diligence before investing any of your own financial assets.
#56
Chart Guru Doug
-
- Traders-Talk User
- 2,789 posts
Member
Posted 23 January 2005 - 11:02 AM
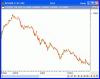
this is from 1999 when uptrending.
showing rally after crows and then going on to lose about 10% off of the crows lows..
Attached Thumbnails
I am not your registered investment advisor. This is not a recomendation to buy or sell. This is my opinion and that is all. I may be long or short any security and change my position at any given moment in time. Do your own due diligence before investing any of your own financial assets.
#57
dcengr
-

- Traders-Talk User
- 13,391 posts
Member
Posted 23 January 2005 - 12:02 PM
May I ask what brings you to this conclusion?If the bulls can hold on til thursday, then MSFT will surely bring some good news. Intel + Dell forecast shows Microsoft will be a big winner, and it makes up a whopping 8% of the NDX.
Why do I think MSFT will report good earnings? Because Intel and Dell are both showing very strong PC sales. For every PC sale, you can bet that MSFT is selling OS, Word, Excel, and a host of other software. Plus very nice XBOX sales thanks to Halo 2. Now they're on the verge of attacking Google. Remember back when Microsoft tackled Netscape? Here's the kicker about the Google competition. There is ZERO regulation risk. Its an independent net service. With Microsoft's cash and resources, they can really pound Google on the development, and with much more impunity than they did tackling the browser wars.
Ofcourse that's my long term outlook on Microsoft. Short term, I think people will start talking about the long term outlook and give it a nice boost this coming earnings report.
Qui custodiet ipsos custodes?
#58
Modest Trader
-

- Traders-Talk ~
- 3,141 posts
Member
Posted 23 January 2005 - 12:12 PM
May I ask what brings you to this conclusion?If the bulls can hold on til thursday, then MSFT will surely bring some good news. Intel + Dell forecast shows Microsoft will be a big winner, and it makes up a whopping 8% of the NDX.
Why do I think MSFT will report good earnings? Because Intel and Dell are both showing very strong PC sales. For every PC sale, you can bet that MSFT is selling OS, Word, Excel, and a host of other software. Plus very nice XBOX sales thanks to Halo 2. Now they're on the verge of attacking Google. Remember back when Microsoft tackled Netscape? Here's the kicker about the Google competition. There is ZERO regulation risk. Its an independent net service. With Microsoft's cash and resources, they can really pound Google on the development, and with much more impunity than they did tackling the browser wars.
Ofcourse that's my long term outlook on Microsoft. Short term, I think people will start talking about the long term outlook and give it a nice boost this coming earnings report.
They may report great earnings, but guide down more severely because of the purchase black hole upcoming the next 6-9 months while big buyers wait to buy PCs, etc. until the next MS OS Longhorn is out in 2006. Maybe it won't be as bad a delay as preceded Windows 98 or XP, but it's worth keeping in mind.
#59
IndexTrader
-

- TT Patron+
- 7,694 posts
Member
Posted 23 January 2005 - 12:15 PM
It's difficult to see how you can have a serious conversation about candlesticks when referring to either the Dow Industrials or the SPX. Both indices open near the prior close due to the way the indices are calculated. Thus on days where a gap may take place (like two days ago), SPX and the Dow will distort the candle because it shows an unchanged opening. Same thing is true on 1/3/2005 where we gapped up, yet the Dow and SPX show an unchanged opening. AGain, distortion in the candle.
Thus when one looks at the history of candles, where recent price action isn't fresh in your memory, you have no idea whether one specific candle is correct or not...because you don't know whether there was a gap or not, which changed the type of candle and the potential pattern.
IndexTrader
#60
Chart Guru Doug
-
- Traders-Talk User
- 2,789 posts
Member
Posted 23 January 2005 - 12:35 PM
Yes IndexIt's difficult to see how you can have a serious conversation about candlesticks when referring to either the Dow Industrials or the SPX. Both indices open near the prior close due to the way the indices are calculated. Thus on days where a gap may take place (like two days ago), SPX and the Dow will distort the candle because it shows an unchanged opening. Same thing is true on 1/3/2005 where we gapped up, yet the Dow and SPX show an unchanged opening. AGain, distortion in the candle.
Thus when one looks at the history of candles, where recent price action isn't fresh in your memory, you have no idea whether one specific candle is correct or not...because you don't know whether there was a gap or not, which changed the type of candle and the potential pattern.
IndexTrader
they do not show the gaps but the do show tails and up or down closes. The crow pattern is very rare on the chart and has proven itself pretty effective as you can see by the examples, so it appears to be a very serious pattern.
I am not your registered investment advisor. This is not a recomendation to buy or sell. This is my opinion and that is all. I may be long or short any security and change my position at any given moment in time. Do your own due diligence before investing any of your own financial assets.


